| MWexperimental | 14 | kDa |
| MWexpected | 15 | kDa |
|
log I(s)
1.94×100
1.94×10⁻¹
1.94×10⁻²
1.94×10⁻³
|
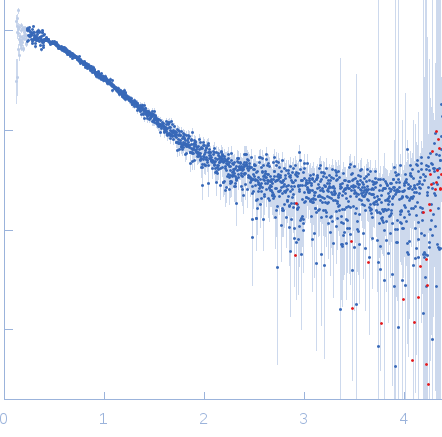 s, nm-1
|
|
|
|

|
|

|
|
Synchrotron SAXS
data from solutions of
HCoV-229E Nsp10 in the absence of Zn
in
25 mM HEPES 400 mM NaCl 1 mM EDTA 5% glycerol 40 mM NaH2PO4, pH 7.9
were collected
on the
EMBL P12 beam line
at the PETRA III storage ring
(DESY; Hamburg, Germany)
using a Pilatus 2M detector
at a sample-detector distance of 3.1 m and
at a wavelength of λ = 0.12 nm
(I(s) vs s, where s = 4πsinθ/λ, and 2θ is the scattering angle).
Solute concentrations ranging between 0.5 and 2.8 mg/ml were measured
at 10°C.
Eight successive
5 second frames were collected.
The data were normalized to the intensity of the transmitted beam and radially averaged; the scattering of the solvent-blank was subtracted.
The low angle data collected at lower concentrations were extrapolated to infinite dilution and merged with the higher concentration data to yield the final composite scattering curve.
|
|
|||||||||||||||||||||||||||


