|
Synchrotron SAXS
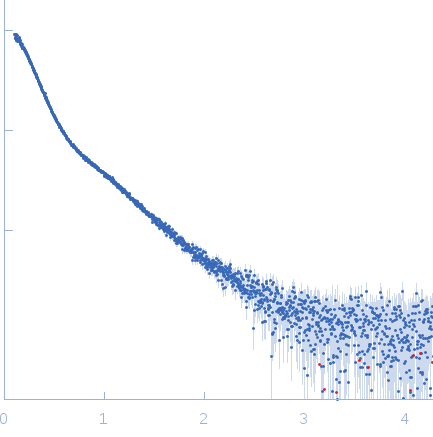
data from solutions of
Cation-free slp-B53
in
Water, pH 7
were collected
on the
EMBL P12 beam line
at the PETRA III storage ring
(DESY; Hamburg, Germany)
using a Pilatus 2M detector
at a sample-detector distance of 3.1 m and
at a wavelength of λ = 0.12 nm
(I(s) vs s, where s = 4πsinθ/λ, and 2θ is the scattering angle).
Solute concentrations ranging between 1 and 7.5 mg/ml were measured
at 10°C.
20 successive
0.050 second frames were collected.
The data were normalized to the intensity of the transmitted beam and radially averaged; the scattering of the solvent-blank was subtracted.
The low angle data collected at lower concentrations were extrapolated to infinite dilution and merged with the higher concentration data to yield the final composite scattering curve.
|
|
S-layer protein
(Slp1)
|
| Mol. type |
|
Protein |
| Organism |
|
Lysinibacillus sphaericus |
| Olig. state |
|
Monomer |
| Mon. MW |
|
116.0 kDa |
| |
| UniProt |
|
M4N8T6
|
| Sequence |
|
FASTA |
| |
|
 s, nm-1


