|
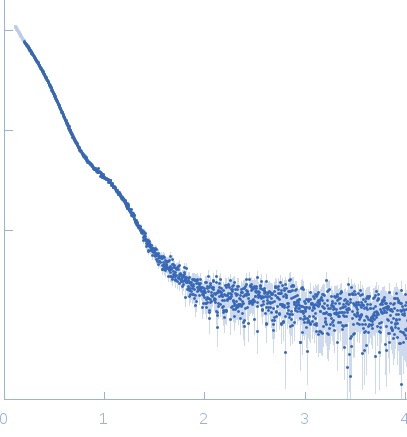
Synchrotron SAXS data from solutions of 5-keto-4-deoxyuronate isomerase (KduI) from E. coli in 50 mM Tris, pH 7.5 were collected on the P12 beam line of Petra-III (Hamburg, Germany) using a Pilatus 2M detector (I(s) vs s; s = 4π sin θ/λ, where 2θ is the scattering angle and λ=0.124 nm). Different solute concentrations in the range 2.7-11.80 mg/ml were measured using an exposure time of 1 s (recorded as 20 x 0.050 s frames). The data were normalized to the intensity of the transmitted beam and radially averaged and the scattering from the matched solvent-blank was subtracted. The data presented here are from a single concentration scattering curve (4.0 mg/ml).
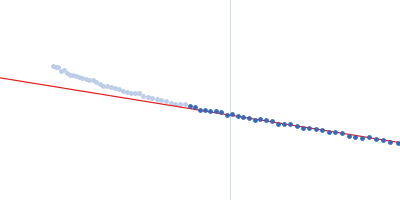
KduI exists of a mixture of species in solution that include dimers, hexamers and dodecamers. The modelling results from OLIGOMER are displayed where, in terms of volume fraction, the KduI sample consists of approximately: 30% dimers, 30% hexamers; 15% stacked dodecamers and 25% extended dodecamers. The OLIGOMER results are included in the zip archive for this entry. In addition, the Guinier plot at low-s2 is non linear. Two regions in the plot can be identified: s2, 0.01–0.035 and 0.04–0.11 nm-2, from which two values of Rg can be approximated (6.2 nm and 4.5 nm).
|
|
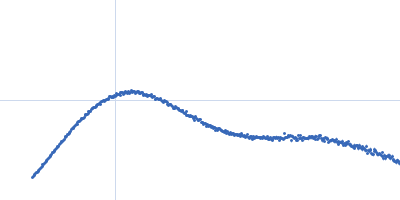
 s, nm-1