Disease Variants of FGFR3 Reveal Molecular Basis for the Recognition and Additional Roles for Cdc37 in Hsp90 Chaperone System.

Bunney TD, Inglis AJ, Sanfelice D, Farrell B, Kerr CJ, Thompson GS, Masson GR, Thiyagarajan N, Svergun DI, Williams RL, Breeze AL, Katan M, Structure 26(3):446-458.e8 (2018) Europe PMC

SASDBP9 – Human Hsp90 co-chaperone Cdc37 protein (CD37)

Hsp90 co-chaperone Cdc37
MWI(0) 49 kDa
MWexpected 44 kDa
VPorod 106 nm3
log I(s) 5.96×10³ 5.96×10² 5.96×101 5.96×100
Hsp90 co-chaperone Cdc37 small angle scattering data  s, nm-1
ln I(s)
Hsp90 co-chaperone Cdc37 Guinier plot ln 5.97×10³ Rg: 4.0 nm 0 (4.0 nm)-2 s2
(sRg)2I(s)/I(0)
Hsp90 co-chaperone Cdc37 Kratky plot 1.104 0 3 sRg
p(r)
Hsp90 co-chaperone Cdc37 pair distance distribution function Rg: 4.2 nm 0 Dmax: 15.5 nm

Data validation


Fits and models


log I(s)
 s, nm-1
Hsp90 co-chaperone Cdc37 CORAL model

log I(s)
 s, nm-1
Hsp90 co-chaperone Cdc37 MONSA model

Synchrotron SAXS data from solutions of human Hsp90 co-chaperone Cdc37 protein (CD37) in 25 mM Tris-HCl, 150 mM NaCl, 5% (v/v) glycerol, 1 mM TCEP, pH 8, were collected on the P12 beam line at the PETRA III storage ring (Hamburg, Germany) using a Pilatus 2M detector at a sample-detector distance of 3.1 m and at a wavelength of λ = 0.124 nm (I(s) vs s, where s = 4πsinθ/λ, and 2θ is the scattering angle). Solute concentrations ranging between 1.1 and 4.2 mg/ml were measured at 20°C. 20 successive 0.045 second frames were collected. The data were normalized to the intensity of the transmitted beam and radially averaged; the scattering of the solvent-blank was subtracted and the different curves were scaled for protein concentration. The low angle data collected at lower concentrations were extrapolated to infinite dilution and merged with the higher concentration data to yield the final composite scattering curve.
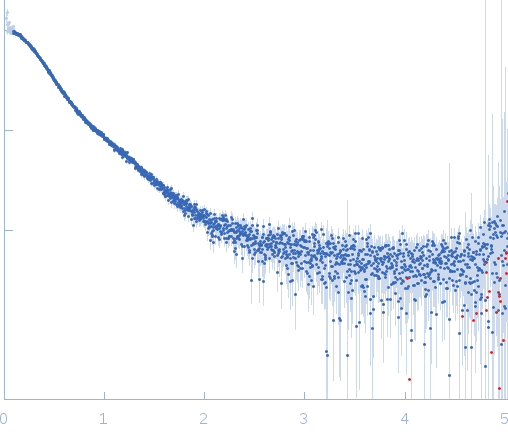
Hsp90 co-chaperone Cdc37 (CDC37)
Mol. type   Protein
Organism   Homo sapiens
Olig. state   Monomer
Mon. MW   44.4 kDa
 
UniProt   Q16543
Sequence   FASTA
 
PDB ID   1US7