|
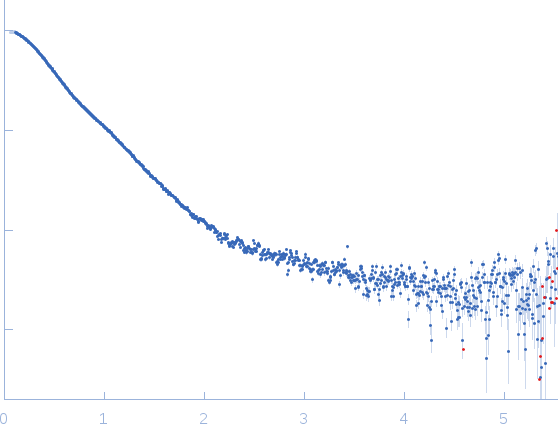
Synchrotron SAXS data from solutions of the GppNHp bound form of full length ObgE from E.coli (ObgE_FL with GppNHp) in 20 mM HEPES, 300 mM NaCl, 250 mM imidazole, 5 mM MgCl2, 2 mM DTT, 400 µM GppNHp, pH 7.5, were collected at the SWING beam line at the SOLEIL Synchrotron (Saint-Aubin, France) using a CCD AVIEX detector at a sample-detector distance of 2.0 m and at a wavelength of λ = 0.103 nm (I(s) vs s, where s = 4πsinθ/λ and 2θ is the scattering angle). Data collection was performed at at 10°C. 255 successive 2.8 second frames were collected through an HPLC-SEC elution peak. The data were normalized to the intensity of the transmitted beam and radially averaged; the scattering of the solvent-blank was subtracted and the different curves were scaled for protein concentration, then averaged to produce the final SAXS profile displayed in this entry.
The sample protein includes a C-terminal Strep-tag; frames corresponding to the peak in HPLC-SAXS run were averaged using DATAVER v0.2 (r3709)
|
|
 s, nm-1


