Revealing the distinct folding phases of an RNA three-helix junction.

Plumridge A, Katz AM, Calvey GD, Elber R, Kirmizialtin S, Pollack L, Nucleic Acids Res 46(14):7354-7365 (2018) Europe PMC

SASDCL4 – Truncated P5abc subdomain from tetrahymena ribozyme: Static 0.50mM MgCl2

Truncated P5abc subdomain from tetrahymena ribozyme
MWexperimental 25 kDa
MWexpected 18 kDa
log I(s) 9.02×101 9.02×100 9.02×10⁻¹ 9.02×10⁻²
Truncated P5abc subdomain from tetrahymena ribozyme small angle scattering data  s, nm-1
ln I(s)
Truncated P5abc subdomain from tetrahymena ribozyme Guinier plot ln 9.02×101 Rg: 2.3 nm 0 (2.3 nm)-2 s2
(sRg)2I(s)/I(0)
Truncated P5abc subdomain from tetrahymena ribozyme Kratky plot 1.104 0 3 sRg
p(r)
Truncated P5abc subdomain from tetrahymena ribozyme pair distance distribution function Rg: 2.3 nm 0 Dmax: 7.2 nm

Data validation


There are no models related to this curve.

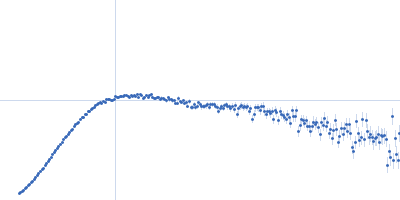
Synchrotron SAXS data from solutions of Truncated P5abc subdomain from tetrahymena ribozyme: Static 0.50mM MgCl2 in 0.5mM MgCl2 20mM KCl 10mM KMOPS 20uM EDTA, pH 7 were collected on the G1 beam line at the Cornell High Energy Synchrotron Source (CHESS; Ithaca, NY, USA) using a CCD Finger Lakes CCD detector at a sample-detector distance of 1.5 m and at a wavelength of λ = 0.109 nm (I(s) vs s, where s = 4πsinθ/λ and 2θ is the scattering angle). Solute concentrations ranging between 0.8 and 1.5 mg/ml were measured at 20°C. 40 successive 10 second frames were collected. The data were normalized to the intensity of the transmitted beam and radially averaged; the scattering of the solvent-blank was subtracted and the different curves were scaled for protein concentration. The low angle data collected at lower concentrations were extrapolated to infinite dilution and merged with the higher concentration data to yield the final composite scattering curve.
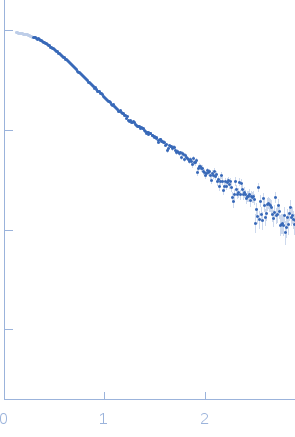
Truncated P5abc subdomain from tetrahymena ribozyme (tp5abc)
Mol. type   RNA
Olig. state   Monomer
Mon. MW   18.2 kDa
Sequence   FASTA