|
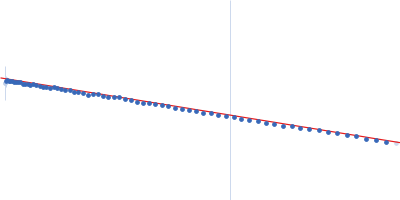
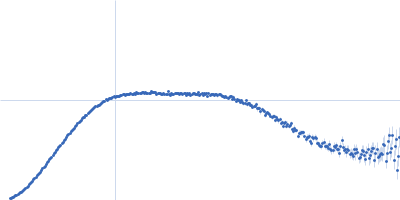
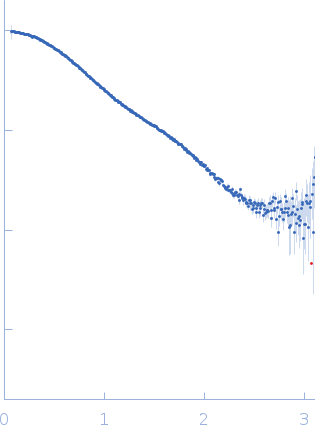
Synchrotron SAXS data from solutions of calcium-loaded calmodulin in 25 mM MOPS, 250 mM NaCl, 50 mM KCl, 2 mM TCEP, 0.1% NaN3, pH 7.5 were collected on the SAXS/WAXS beam line at Australian Synchrotron (Melbourne, Australia) using a Pilatus 1M detector at a sample-detector distance of 2.7 m and at a wavelength of λ = 0.10332 nm (I(s) vs s, where s = 4πsinθ/λ and 2θ is the scattering angle). Scattering data are on an absolute scale (cm-1) set by reference to the scattering from pure H2O at 22°C. I(0) values must be corrected for the shear flow sample cell by a 2.05 multiplicative factor. Data were acquired in SEC-SAXS mode, summed from 12 x 1 second measurement frames where Rg was flat and at a maximum. The average concentration over the frames was 0.959 mg/mL, spanning values from 0.74 - 1.1 mg/mL. Sample concentrations were measured by A280 (extinction coefficient for 1 mg/mL, 10 mm pathlength; E0.1% = 0.178), corrected for the 3.1 mm path-length of the UV measurement cell. MULCh was used to calculate the partial specific volume (0.716 mL/g) and X-ray contrast (Δρ = 3.093e10 cm-2). The protein is a monomer in the solution conditions measured, experimental molecular weight provided includes the 4 bound calcium ions. The multi-state (Multi-FoXS, 1-state and 2-sate fits) and ensemble model (EOM, lower panel) fits to the data assumed flexibility in residues 77-81, the region identified by NMR relaxation as highly mobile in the helix connecting the N- and C-terminal CaM domains. The distribution of Rg values shown for the EOM fit represents the pool (gray) and the optimized ensemble (blue).
Storage temperature = UNKNOWN
|
|
 s, nm-1
 Rg, nm