Analysis of the natively unstructured RNA/protein-recognition core in the Escherichia coli RNA degradosome and its interactions with regulatory RNA/Hfq complexes.

Bruce HA, Du D, Matak-Vinkovic D, Bandyra KJ, Broadhurst RW, Martin E, Sobott F, Shkumatov AV, Luisi BF, Nucleic Acids Res 46(1):387-402 (2018) Europe PMC

SASDCY4 – RNase E 603-850

RNase E 603-850
MWexperimental 49 kDa
MWexpected 30 kDa
VPorod 139 nm3
log I(s) 4.90×10⁻² 4.90×10⁻³ 4.90×10⁻⁴ 4.90×10⁻⁵
RNase E 603-850 small angle scattering data  s, nm-1
ln I(s)
RNase E 603-850 Guinier plot ln 4.90×10⁻² Rg: 5.3 nm 0 (5.3 nm)-2 s2
(sRg)2I(s)/I(0)
RNase E 603-850 Kratky plot 1.104 0 3 sRg
p(r)
RNase E 603-850 pair distance distribution function Rg: 5.7 nm 0 Dmax: 27.5 nm

Data validation


Fits and models


log I(s)
 s, nm-1
RNase E 603-850 Rg histogram Rg, nm
RNase E 603-850 EOM/RANCH model

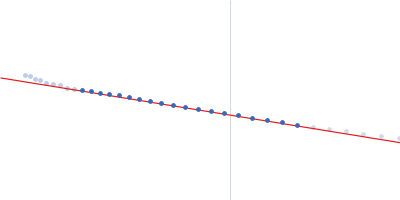
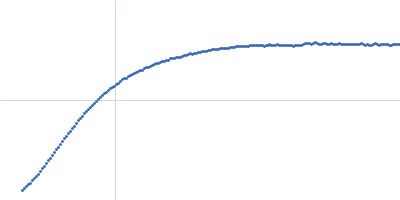
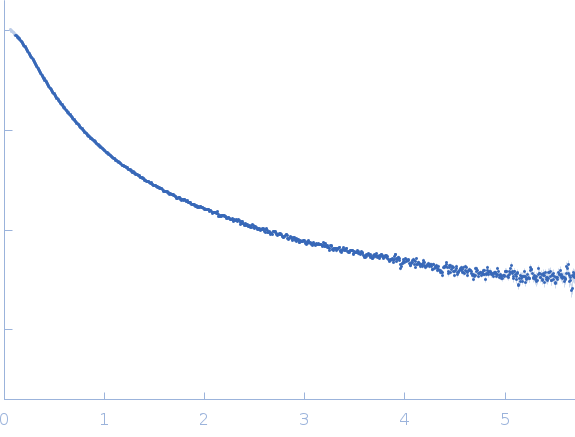
SAXS data (I(s) vs s, where s = 4πsinθ/λ and 2θ is the scattering angle) were collected on the SWING beam line at Soleil synchrotron (Gif-sur-Yvette, France). Samples were stored at 288 K in a robotic sample chamber and automatically loaded (12.00 mg/ml) onto a Superdex 200 Increase 3.2/300 gel-filtration column (GE Healthcare) equilibrated with 50 mM Tris HCl pH 7.5, 100 mM NaCl, 100 mM KCl, 10 mM MgCl2, 10 mM DTT and 5 % glycerol (v/v), at a flow rate of 150 μl min-1 by a HPLC (High performance liquid chromatography) instrument (Agilent), directly before elution into the sample detection chamber, where a monochromatic beam illuminated the sample with a wavelength of 0.1022 nm as it flowed through. The sample-detector distance was 1.79 m. During the elution, 250 scattering measurements were taken with 1.5-s time-frames and 0.5-s dead-time between frames. The in-house program FOXTROT (David and Pérez, 2009) was used to normalize and radially average the data. After averaging 20-30 buffer frames in PRIMUS (Konarev et al., 2003), the program DATASW (Shkumatov and Strelkov, 2015) was employed to (i) subtract the buffer average from each sample frame and (ii) calculation of I(0), Rg and MW. Frames corresponding to the peak where Rg was stable were used for averaging.

Concentration min = UNKNOWN

Tags: idp
RNase E 603-850 (RNase E 603-850)
Mol. type   Protein
Organism   Escherichia coli
Olig. state   Monomer
Mon. MW   30.1 kDa
 
UniProt   Q46977 (603-850)
Sequence   FASTA