|
Synchrotron SAXS
data from solutions of
anti-TG2 antibody (679 14 E06)
in
20 mM Tris 150mM NaCl 1mM EDTA, pH 7.2
were collected
on the
EMBL P12 beam line
at the PETRA III storage ring
(DESY; Hamburg, Germany)
using a Pilatus 2M detector
at a sample-detector distance of 3.1 m and
at a wavelength of λ = 0.12 nm
(I(s) vs s, where s = 4πsinθ/λ, and 2θ is the scattering angle).
Solute concentrations ranging between 2 and 16 mg/ml were measured
at 10°C.
20 successive
0.050 second frames were collected.
The data were normalized to the intensity of the transmitted beam and radially averaged; the scattering of the solvent-blank was subtracted.
The low angle data collected at lower concentration were merged with the highest concentration high angle data to yield the final composite scattering curve.
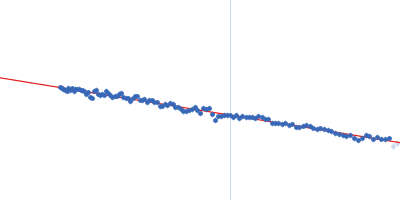
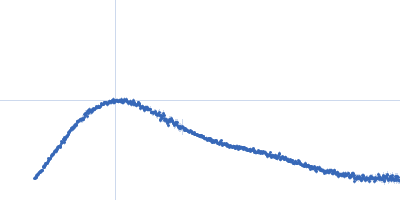
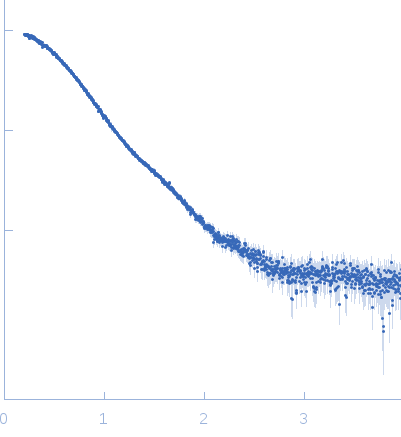
Structural basis for antigen recognition by transglutaminase 2-specific autoantibodies in celiac disease --- SAXS profile of the autoantibody
|
|
 s, nm-1