| MWexperimental | 67 | kDa |
| MWexpected | 67 | kDa |
| VPorod | 110 | nm3 |
|
log I(s)
1.30×10²
1.30×101
1.30×100
1.30×10⁻¹
|
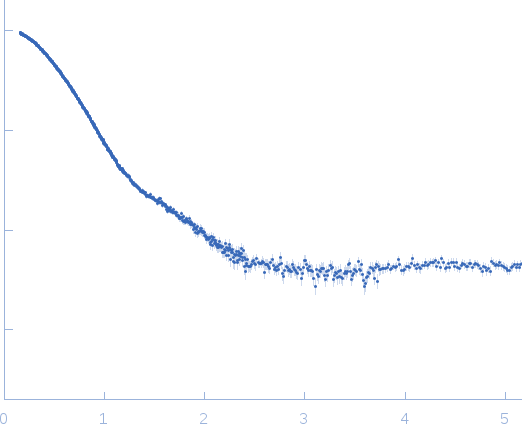 s, nm-1
|
|
|
|

|
|

|
|
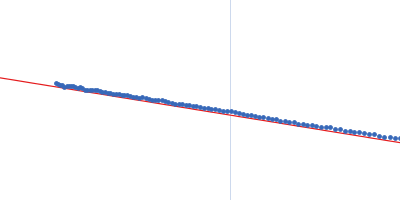
Synchrotron SAXS
data from solutions of
RNA shaperone Hfq
in
50 mM Tris-HCL 150 mM NaCl 1.0 mM DTT, pH 7.5
were collected
on the
EMBL X33 beam line
at the DORIS III, DESY storage ring
(Hamburg, Germany)
using a MAR 345 Image Plate detector
(I(s) vs s, where s = 4πsinθ/λ, and 2θ is the scattering angle).
Solute concentrations ranging between 2.3 and 18.5 mg/ml were measured
at 37°C.
Two successive
120 second frames were collected.
The data were normalized to the intensity of the transmitted beam and radially averaged; the scattering of the solvent-blank was subtracted.
The low angle data collected at lower concentration were merged with the highest concentration high angle data to yield the final composite scattering curve.
Wavelength = UNKNOWN. Sample detector distance = UNKNOWN
Tags:
X33
|
|
|||||||||||||||||||||