|
Synchrotron SAXS
data from solutions of
Native complex CytC_Adr
in
20 mM HEPES 2 mM DTT, pH 7.4
were collected
on the
EMBL X33 beam line
at the DORIS III, DESY storage ring
(Hamburg, Germany)
using a MAR 345 Image Plate detector
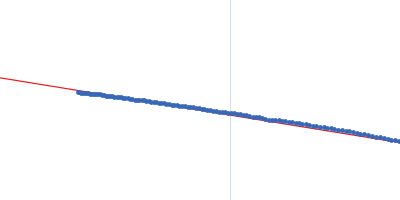
(I(s) vs s, where s = 4πsinθ/λ, and 2θ is the scattering angle).
Solute concentrations ranging between 2.4 and 24 mg/ml were measured
at 15°C.
Two successive
120 second frames were collected.
The data were normalized to the intensity of the transmitted beam and radially averaged; the scattering of the solvent-blank was subtracted.
The low angle data collected at lower concentration were merged with the highest concentration high angle data to yield the final composite scattering curve.
Wavelength = UNKNOWN. Sample detector distance = UNKNOWN
|
|
Cytochrome C dimer
(Cyt_C_dimer)
|
| Mol. type |
|
Protein |
| Organism |
|
Escherichia coli |
| Olig. state |
|
Dimer |
| Mon. MW |
|
11 kDa |
| Sequence |
|
FASTA |
| |
|
Adrenodoxin dimer
(Adrenodoxin dimer)
|
| Mol. type |
|
Protein |
| Organism |
|
Escherichia coli |
| Olig. state |
|
Dimer |
| Mon. MW |
|
11 kDa |
| Sequence |
|
FASTA |
| |
|
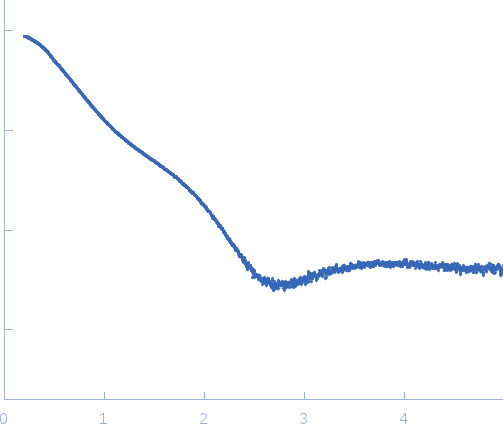 s, nm-1