Synchrotron SAXS
data from solutions of
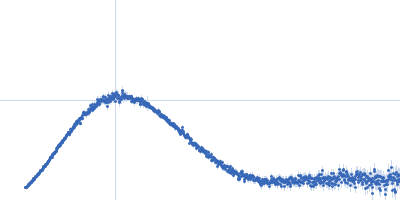
Ks-Amt5-HK (+10uM ATP)
in
20 mM Tris/HCl,100 mM NaCl, 5%(w/v) glycerol, pH 8
were collected
on the
EMBL P12 beam line
at the PETRA III storage ring
(DESY; Hamburg, Germany)
using a Pilatus 2M detector
at a sample-detector distance of 2.7 m and
at a wavelength of λ = 0.124 nm
(I(s) vs s, where s = 4πsinθ/λ, and 2θ is the scattering angle).
Solute concentrations ranging between 1 and 5 mg/ml were measured
at 20°C.
20 successive
0.050 second frames were collected.
The data were normalized to the intensity of the transmitted beam and radially averaged; the scattering of the solvent-blank was subtracted.
The low angle data collected at lower concentration were merged with the highest concentration high angle data to yield the final composite scattering curve.
 s, nm-1