|
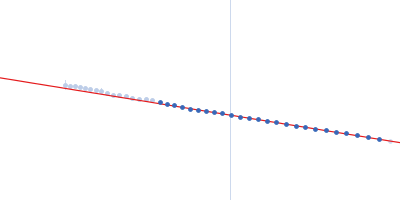
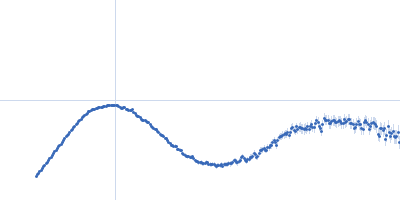
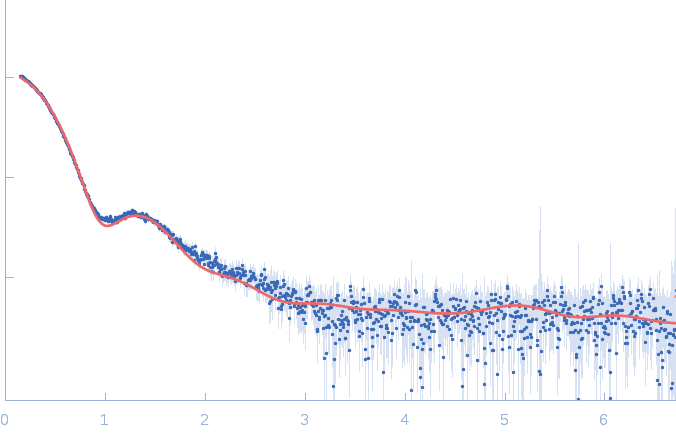
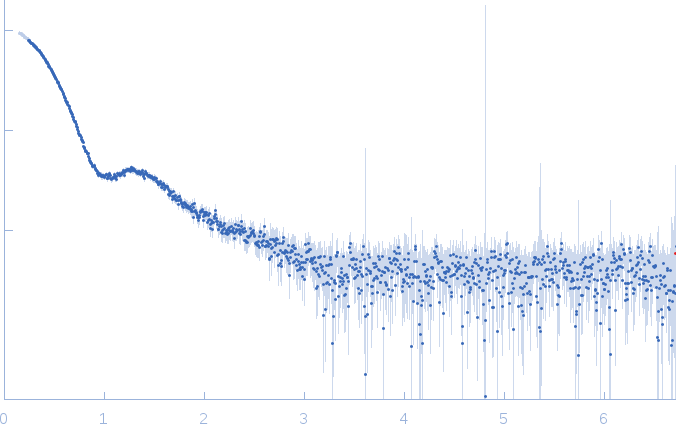
Synchrotron SAXS data from solutions of TET12(2.3)SN-f5b in 20 mM Tris 150 mM NaCl 10% glycerol, pH 7.5 were collected on the P12 beam line at the PETRA III storage ring (Hamburg, Germany) using a Pilatus 1M detector at a sample-detector distance of 2 m and at a wavelength of λ = 0.124 nm (I(s) vs s, where s = 4πsinθ/λ and 2θ is the scattering angle). Solute concentrations ranging between 1.1 and 4.1 mg/ml were measured at 20°C. 20 successive 0.045 second frames were collected. The data were normalized to the intensity of the transmitted beam and radially averaged; the scattering of the solvent-blank was subtracted and the different curves were scaled for protein concentration. The low angle data collected at lower concentration were merged with the highest concentration high angle data to yield the final composite scattering curve. To detect any potential concentration dependent effects a series consisting of 3 concentrations was measured. The highest concentration was 4.1 mg/ml, while the lowest concentrations was 1.1 mg/ml. Frames were carefully inspected for radiation damage and those not showing any radiation damage were then averaged. Before and after each sample scattering, matching buffer was measured and subtracted from sample scattering. Scattering curves were merged and analyzed using PRIMUS software.
|
|
TET12(2.3)SN-f5b
|
| Mol. type |
|
Protein |
| Organism |
|
synthetic construct |
| Olig. state |
|
Monomer |
| Mon. MW |
|
56.7 kDa |
| Sequence |
|
FASTA |
| |
|
 s, nm-1