|
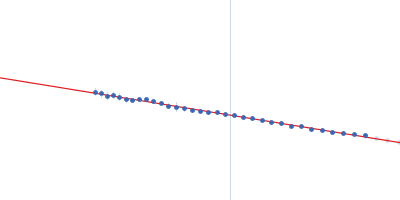
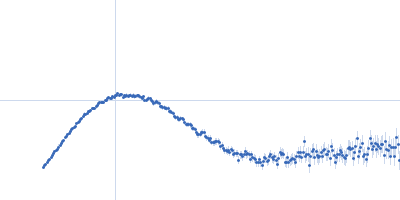
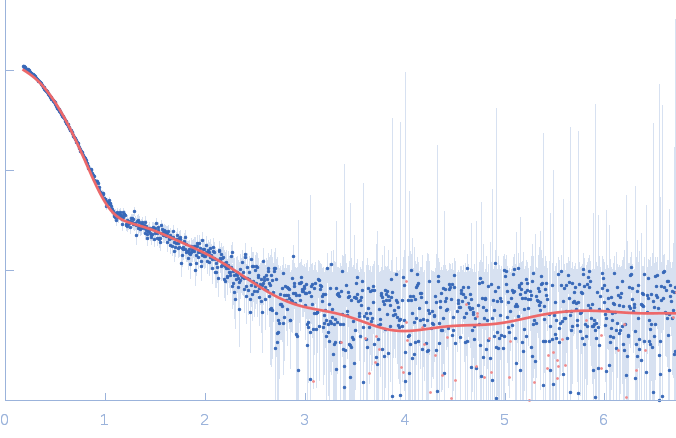
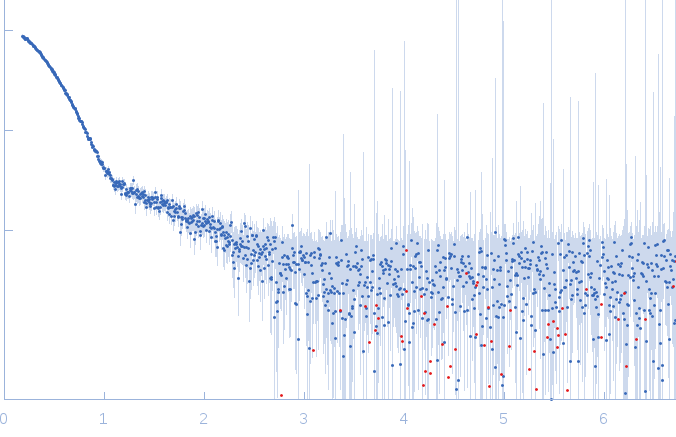
Synchrotron SAXS data from solutions of TET12(1.6)S-c6b in 20 mM Tris 150 mM NaCl 10% glycerol, pH 7.5 were collected on the P12 beam line at the PETRA III storage ring (Hamburg, Germany) using a Pilatus 1M detector at a sample-detector distance of 2 m and at a wavelength of λ = 0.124 nm (I(s) vs s, where s = 4πsinθ/λ and 2θ is the scattering angle). Solute concentrations ranging between 1 and 5 mg/ml were measured at 20°C. 20 successive 0.045 second frames were collected. The data were normalized to the intensity of the transmitted beam and radially averaged; the scattering of the solvent-blank was subtracted and the different curves were scaled for protein concentration. Scattering curves were merged and analyzed using PRIMUS software.
Concentration min = UNKNOWN
|
|
TET12(1.6)S-c6b
|
| Mol. type |
|
Protein |
| Organism |
|
synthetic construct |
| Olig. state |
|
Monomer |
| Mon. MW |
|
54.5 kDa |
| Sequence |
|
FASTA |
| |
|
 s, nm-1