|
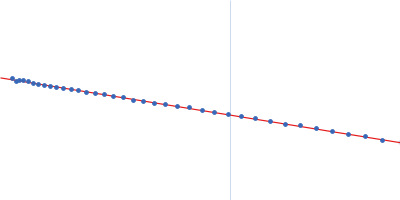
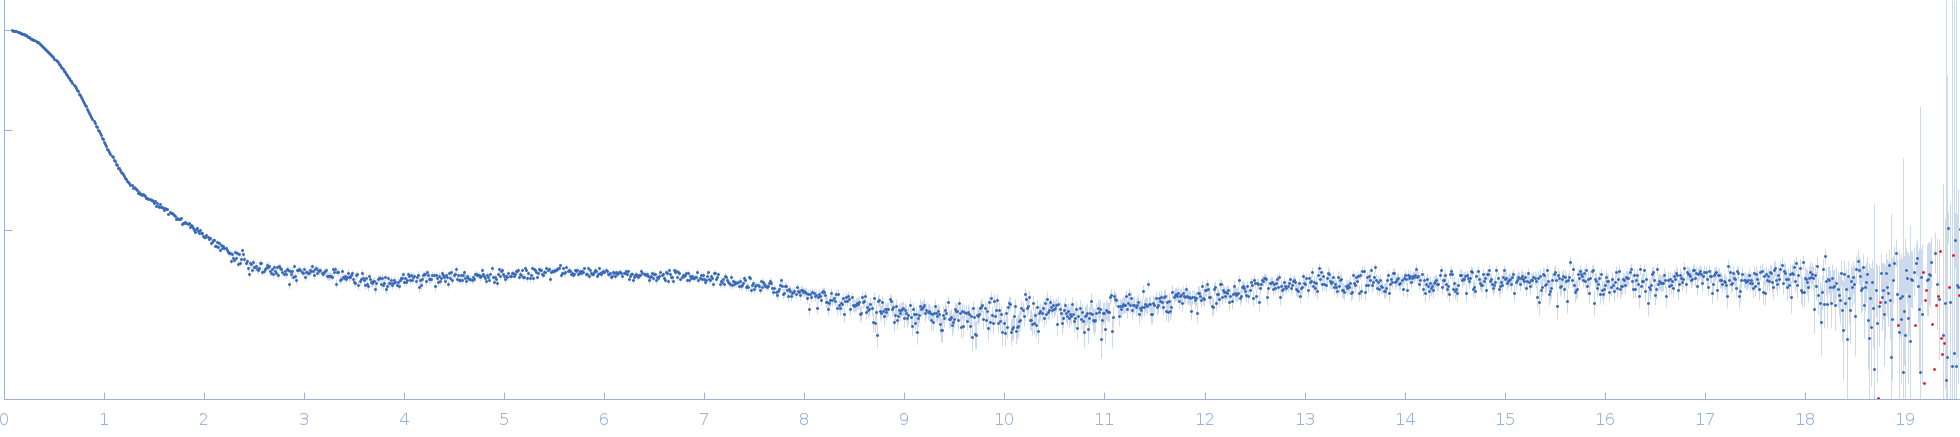
Synchrotron SAXS data from solutions of BSA monomer in 50 mM HEPES, 3% v/v glycerol, pH 7.5 were collected on the EMBL P12 beam line at PETRA III (DESY, Hamburg, Germany) using a Pilatus 2M detector at a sample-detector distance of 1 m and at a wavelength of λ = 0.124 nm (I(s) vs s, where s = 4πsinθ/λ, and 2θ is the scattering angle). In-line size-exclusion chromatography (SEC) SAS was employed. The SEC parameters were as follows: A 80.00 μl sample at 15 mg/ml was injected at a 0.50 ml/min flow rate onto a GE Superdex 200 Increase 10/300 column at 20°C. 63 successive 1 second frames were collected through the major SEC-elution peak and processed using CHROMIXS. The data were normalized to the intensity of the transmitted beam and radially averaged; the scattering of the solvent-blank was subtracted.
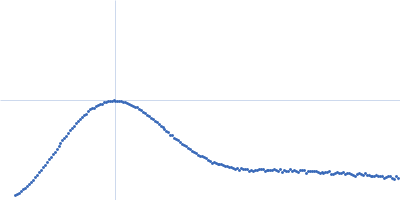
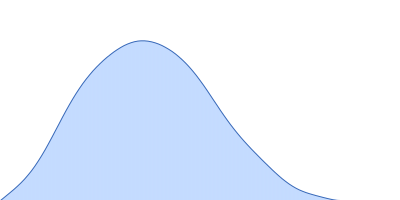
Protein powder (Sigma) consisting of BSA monomers, dimers, trimers and higher MW species was dissolved in the SEC-running buffer and then 0.22 micon spin filtered prior to injection onto the SEC column. The sample injection concentration was determined from triplicate UV A280 measurements using an E0.1% of 0.646 (= 1 g/l) calculated from the amino acid sequence (ProtParam). The Rg-correlation through the SEC-SAXS/WAXS peak, the individual unsubtracted SEC-SAXS/WAXS frames as well as the results from coupled MALLS and QELS analysis are included in the full entry zip archive. The quoted experimental molecular weight was determined from the separated monomer peak using MALLS in combination with refractive-index (RI) measurements from the same sample eluting from the column using a split-flow SEC-SAXS/WAXS-light scattering configuration (Graewert et al., (2015) Sci. Reports. 5, 10734: doi: 10.1038/srep10734). The average hydrodynamic radius of the separated monomer was evaluated at 3.5 nm. Two atomistic representations of the protein are displayed: 1) The X-ray crystallography model fit to the SAXS data (PDB:4F5S), middle, and; 2) The same model after normal mode analysis/refinement using SREFLEX (bottom; Panjkovich et al., (2016) Phys. Chem. Chem. Phys. 18(8):5707-5719. doi: 10.1039/c5cp04540a). The complete SREFLEX result summary is included in the full-entry zip archive.
|
|
 s, nm-1