Low Resolution Structure Determination Shows Procollagen C-Proteinase Enhancer to be an Elongated Multidomain Glycoprotein

Bernocco S, Steiglitz B, Svergun D, Petoukhov M, Ruggiero F, Ricard-Blum S, Ebel C, Geourjon C, Deléage G, Font B, Eichenberger D, Greenspan D, Hulmes D, Journal of Biological Chemistry 278(9):7199-7205 (2003) DOI

SASDLB7 – Procollagen C-proteinase enhancer

Procollagen C-endopeptidase enhancer 1
MWexperimental 46 kDa
MWexpected 46 kDa
VPorod 117 nm3
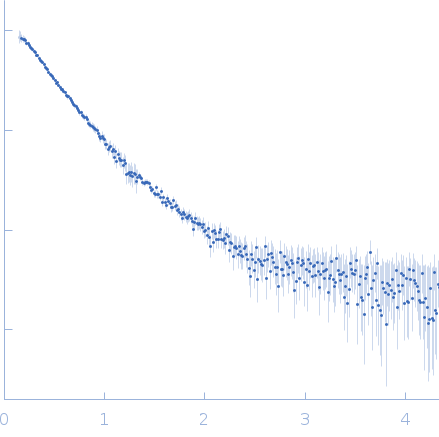
log I(s) 5.48×10² 5.48×101 5.48×100 5.48×10⁻¹
Procollagen C-endopeptidase enhancer 1 small angle scattering data  s, nm-1
ln I(s)
Procollagen C-endopeptidase enhancer 1 Guinier plot ln 5.49×10² Rg: 4.1 nm 0 (4.1 nm)-2 s2
(sRg)2I(s)/I(0)
Procollagen C-endopeptidase enhancer 1 Kratky plot 1.104 0 3 sRg
p(r)
Procollagen C-endopeptidase enhancer 1 pair distance distribution function Rg: 4.3 nm 0 Dmax: 15 nm

Data validation


Fits and models


log I(s)
 s, nm-1
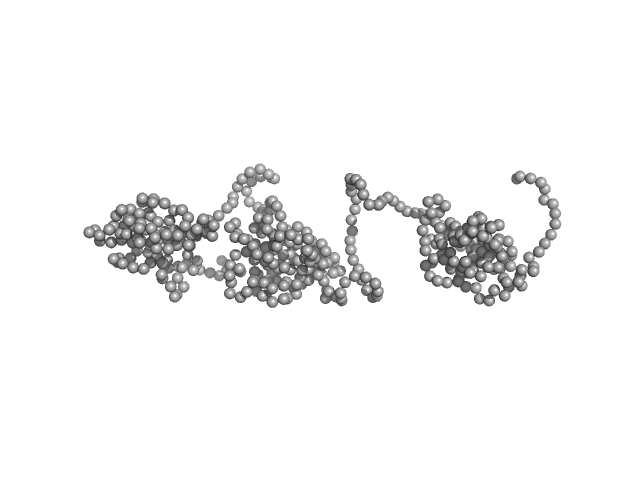
Procollagen C-endopeptidase enhancer 1 GASBOR model

Synchrotron SAXS data from solutions of Procollagen C-proteinase enhancer in 20 mM Hepes, 500 mM NaCl, pH 7.4 were collected on the EMBL X33 beam line at the DORIS III, DESY storage ring (Hamburg, Germany) using a 1D Gas detector detector at a sample-detector distance of 1.8 m and at a wavelength of λ = 0.15 nm (I(s) vs s, where s = 4πsinθ/λ, and 2θ is the scattering angle). Solute concentrations ranging between 3.1 and 30.8 mg/ml were measured . 10 successive 60 second frames were collected. The data were normalized to the intensity of the transmitted beam and radially averaged; the scattering of the solvent-blank was subtracted. The low angle data collected at lower concentration were merged with the highest concentration high angle data to yield the final composite scattering curve.

Cell temperature = UNKNOWN. Storage temperature = UNKNOWN

Tags: X33
Procollagen C-endopeptidase enhancer 1 (PCPE)
Mol. type   Protein
Organism   Homo sapiens
Olig. state   Monomer
Mon. MW   45.5 kDa
 
UniProt   Q15113 (26-449)
Sequence   FASTA