|
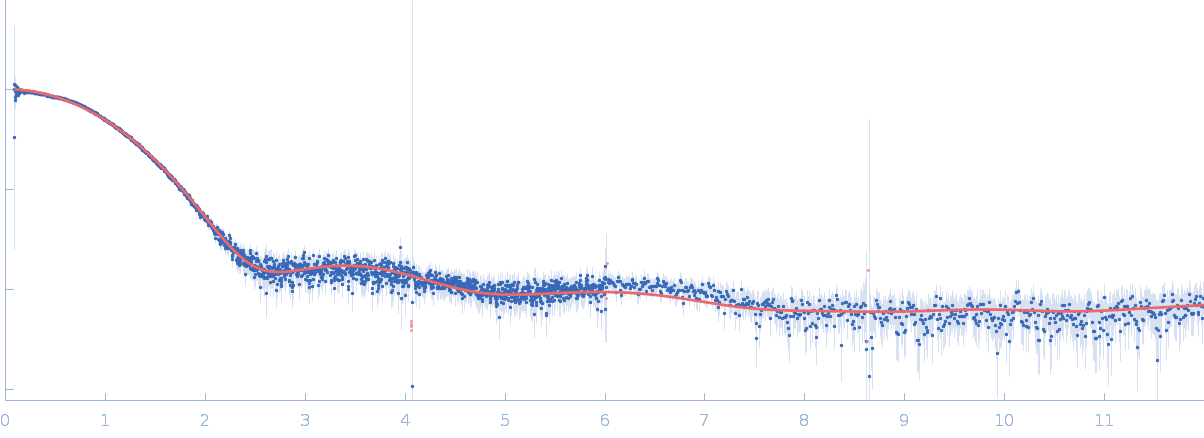
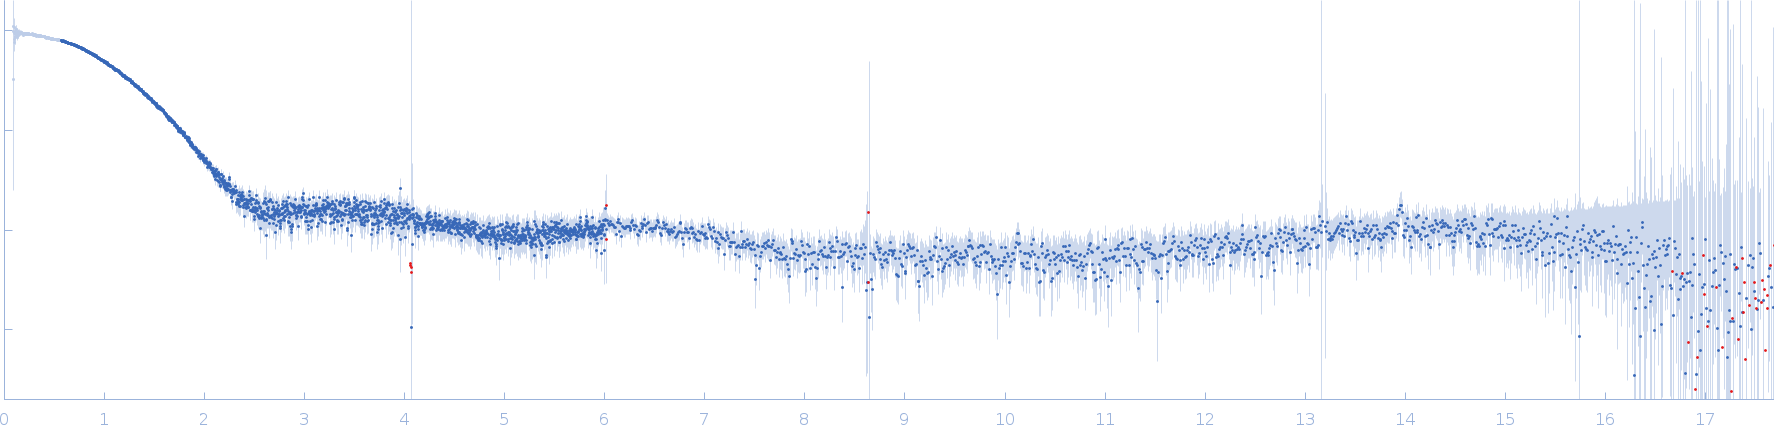
Synchrotron SAXS
data from solutions of
Lysozyme in sodium acetate
in
40 mM Sodium Acetate, pH 3.8
were collected
on the
EMBL X33 beam line
at the DORIS III, DESY storage ring
(Hamburg, Germany)
using a Pilatus 1M-W detector
at a sample-detector distance of 2.7 m and
at a wavelength of λ = 0.15 nm
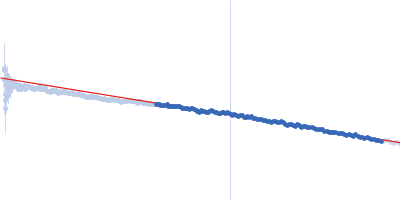
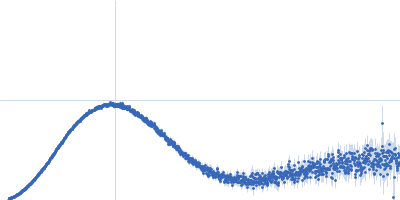
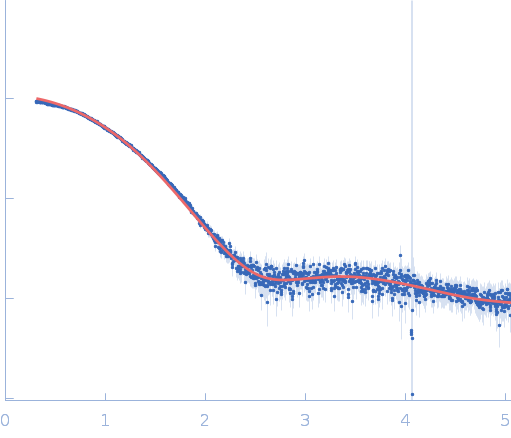
(I(s) vs s, where s = 4πsinθ/λ, and 2θ is the scattering angle).
One solute concentration of 8.09 mg/ml was measured
at 10°C.
Eight successive
15 second frames were collected.
The data were normalized to the intensity of the transmitted beam and radially averaged; the scattering of the solvent-blank was subtracted.
The low angle data collected at lower concentration were merged with the highest concentration high angle data to yield the final composite scattering curve.
Concentration min = UNKNOWN
|
|
Lysozyme C
(Lys)
|
| Mol. type |
|
Protein |
| Organism |
|
Gallus gallus |
| Olig. state |
|
Monomer |
| Mon. MW |
|
16.2 kDa |
| |
| UniProt |
|
P00698
|
| Sequence |
|
FASTA |
| |
|
PDB ID
|
|
1LYZ
|
| |
|
 s, nm-1