| MWexperimental | 50 | kDa |
| MWexpected | 50 | kDa |
| VPorod | 64 | nm3 |
|
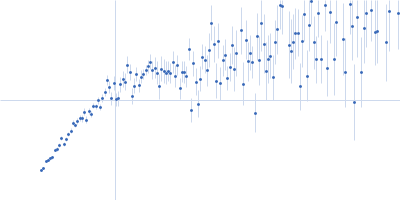
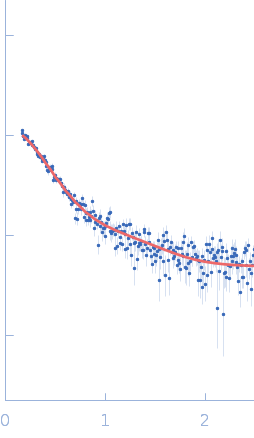
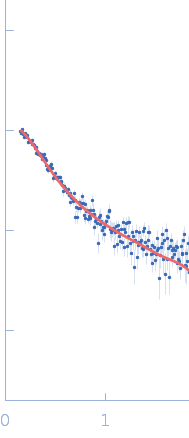
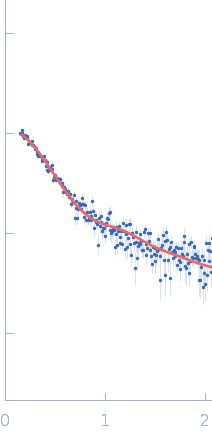
log I(s)
1.94×10⁻³
1.94×10⁻⁴
1.94×10⁻⁵
1.94×10⁻⁶
|
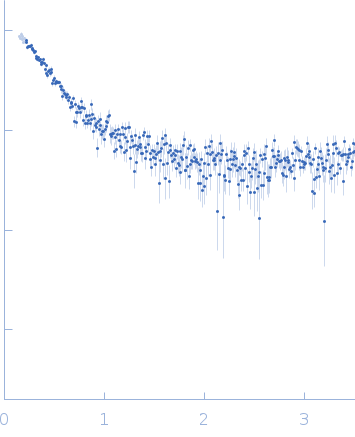 s, nm-1
|
|
|
|
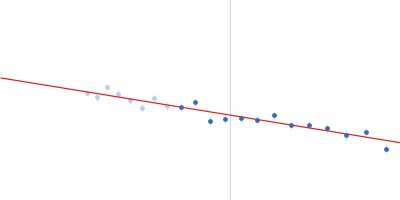
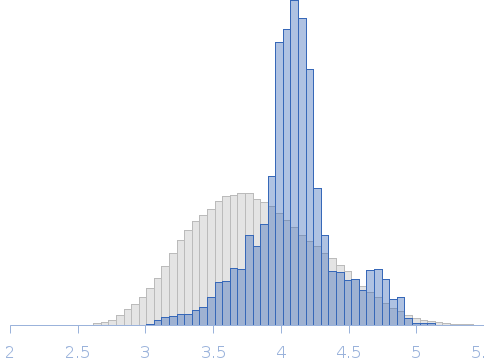 Rg, nm
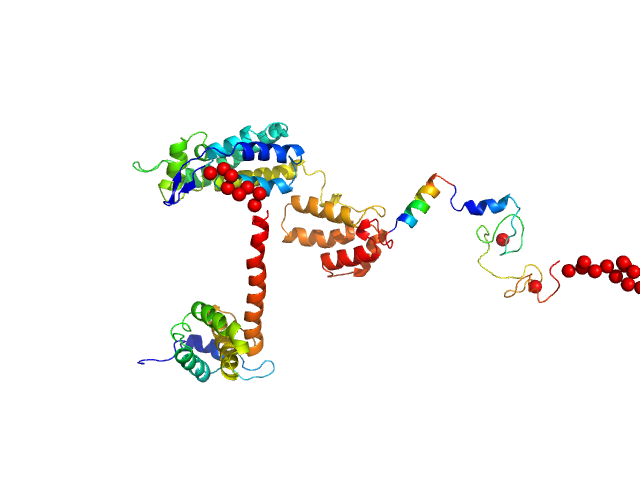
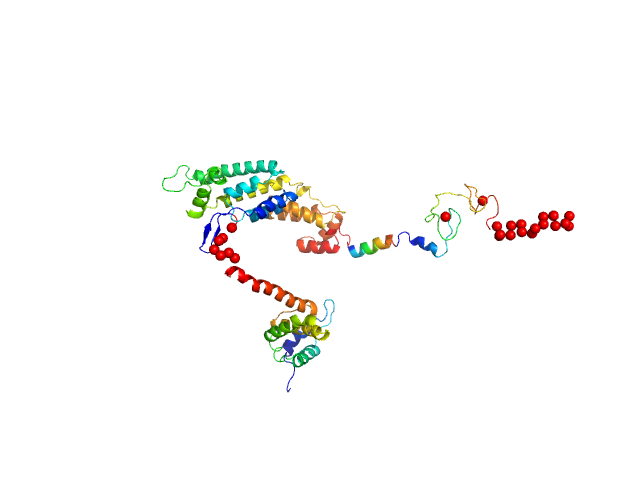
|
|
|
|
|
|
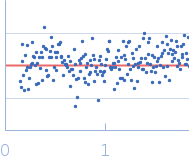
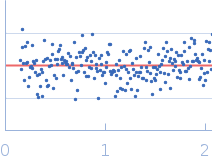
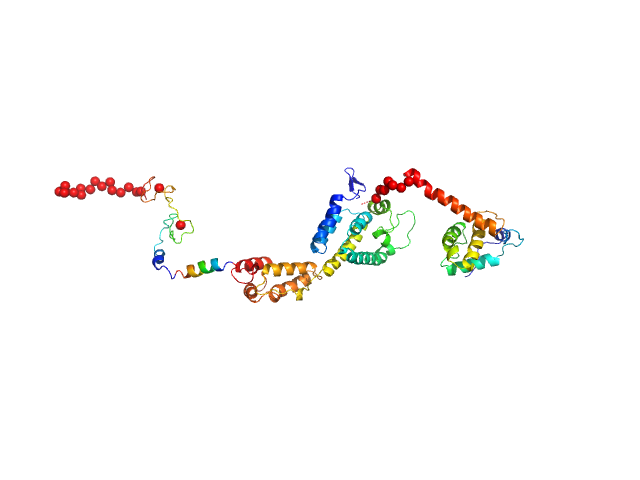
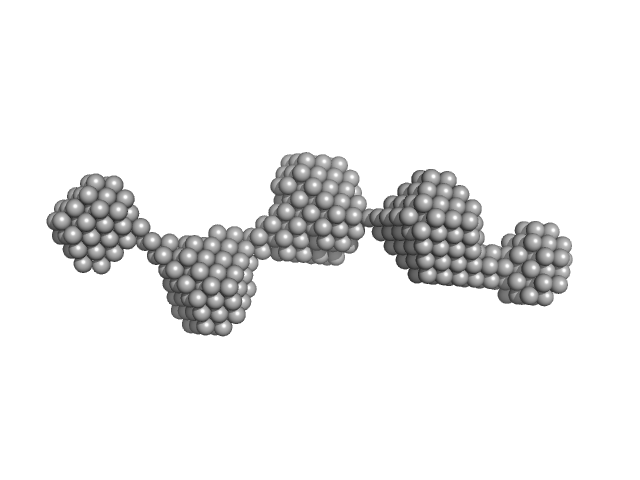
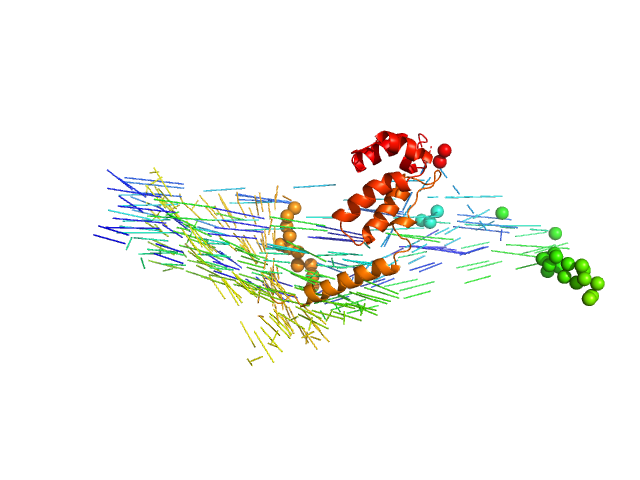
Synchrotron SAXS
data from solutions of
Human immunodeficiency virus type 1 (HIV-1) Gag Polyprotein at 2 mg/ml
in
20 mM Tris, 500 mM NaCl, 1 mM phenylmethylsulfonyl fluoride, 10 mM beta-mercaproethanol, 1 µM ZnCl2, pH 7.4
were collected
on the
EMBL P12 beam line
at the PETRA III storage ring
(DESY; Hamburg, Germany)
using a Pilatus 2M detector
at a sample-detector distance of 3 m and
at a wavelength of λ = 0.123983 nm
(I(s) vs s, where s = 4πsinθ/λ, and 2θ is the scattering angle).
One solute concentration of 2.00 mg/ml was measured
at 10°C.
20 successive
0.045 second frames were collected.
The data were normalized to the intensity of the transmitted beam and radially averaged; the scattering of the solvent-blank was subtracted.
|
|
|||||||||||||||||||||||||||