Help
SASBDB is a curated repository that makes small angle scattering (SAS) data underlying scientific publications discoverable and citable. You can browse the SAS data, search by various keywords including macromolecule name, buffer composition, experiment setup and author/affiliation details.
SASBDB contents
|
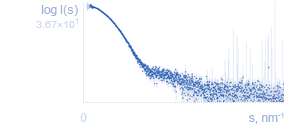
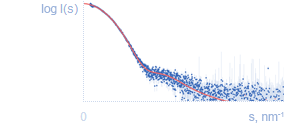
Experimental SAS dataSAS data from solutions of biological macromolecules are presented as log10I(s) vs. s where I(s) is the intensity (in arbitrary units) and s is the modulus of the scattering vector (in inverse nanometres, s = 4πsin(θ)/λ, where 2θ is the scattering angle, λ is the wavelength). Due to experimental errors a small number of intensities may be negative, these data points are shown in red. |
|
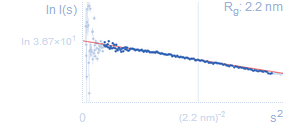
Guinier plotLow angle data plotted as ln I(s) vs. s2 is called the Guinier plot. From it one can estimate the radius of gyration (Rg) by making a linear fit at sufficiently small scattering vectors (in the range up to sRg < 1.0–1.3; s = 1/Rg is marked with a vertical grey line). The linearity of the Guinier plot is a sensitive indicator of the quality of the experimental SAS data; deviations from linearity usually point to strong interference effects, polydispersity of the samples or improper background subtraction.Rg: radius of gyrationFrom the slope of the Guinier plot fit one can estimate the radius of gyration of the particle – average of square center-of-mass distances in the particle weighted by the scattering length density. Rg is a measure for the overall size of a macromolecule; e.g. a protein with a smaller Rg is more compact than a protein with a larger Rg, provided both have the same molecular weight (MW). A more precise Rg estimate can be obtained from integrating the p(r) function (see below).I(0): forward scattering intensityThe intercept of the Guinier plot fit gives the forward scattering (or zero angle scattering) intensity I(0) which is proportional to the solution concentration and to the number of atoms in the particle.MWI(0): molecular weight estimated from forward scatteringI(0) usually comes in arbitrary units, however if a standard was measured (e.g. water or a reference protein like BSA with known MW) then I(0) can be used to obtain a rough estimate of the molecular weight of the sample.MWexpected: expected molecular weightEstimated MW is compared to the expected molecular weight (e.g. calculated from the sequence). This gives an idea of the oligomeric state of the sample. |
|
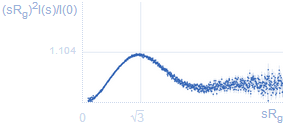
Experimental SAS data dimensionless Kratky plotDegree of compactness of a protein is most conveniently represented as s2I(s) vs. s: a bell-shaped peak indicates a globular particle, a plateau is typical for extended/unfolded proteins.If the intensities are divided by I(0) and s is multiplied by Rg then the plot is called normalized (or dimensionless) Kratky plot. In case of a globular particle the peak position would at √3, maximum at 1.104 (marked with grey lines). VPorod: Porod volumeFor globular particles of uniform density the excluded volume of the hydrated particle is inversely related to the area below the Kratky plot. For globular proteins the hydrated volume in nm3 should be about 1.6 times the MW in kDa. |
|
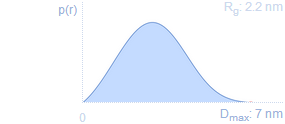
Pair distance distribution functionp(r) represents the distribution of distances between all pairs of atoms within the particle weighted by the respective electron densities. p(r) is the Fourier transform of I(s) (and vice versa). Rg and I(0) can be estimated from integrating the p(r) function. Acceptable formats are: ATSAS GNOM, GIFT, BioXTAS RAW and ScÅtter.Dmax: maximum intra-particle distanceThe point where p(r) is decaying to zero is called Dmax and represents the maximum size of the particle. |
Modelling |
|
|
Fit to the experimental dataThe experimental scattering curve (in blue) can be compared with the theoretical curve calculated from a model (in red). |
|
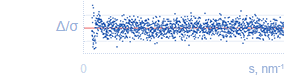
Residual difference plotThe error-weighted residual difference plot demonstrates the quality of a model fit taking into account relative experimental errors. |
|
|
Data validationPercentile rank sliders compare quality indicators for a given fit/data set with those of previously deposited SASBDB entries. Click "Data validation" or [+] to display them. |
|
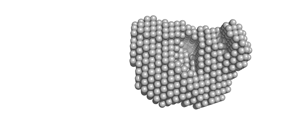
Ab initio modelReconstruction of the low resolution shape based on experimental scattering data only is called an ab initio model. Typically the particle shape is represented by densely packed spheres that are assembled such that their computed scattering fits the experimental data. On a page with data details please click the ab initio model image to load the 3D view. |
|
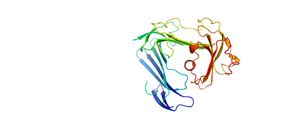
Hybrid modelIt is possible to compute a theoretical solution scattering curve from the given atomic coordinates. A number of programs can assemble models that fit given experimental SAS data using structures obtained from X-ray crystallography, NMR and other techniques. On a page with data details please click the hybrid model image to load the 3D view. |
|
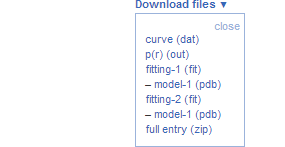
DownloadIt is possible to download:
|
Tags
SASBDB provides a useful way to group related entries together and to classify them by using: SASBDB tags
REST API
SASBDB provides a programmatic way to obtain information in JSON and XML formats: REST calls based on SASBDB entry data
Contact us
SASBDB is powered by the Biological Small Angle Scattering Group, European Molecular
Biology Laboratory, Hamburg Outstation.
For questions and feedback please contact:
.