|
Synchrotron SAXS
data from solutions of
Human linear tetraubiquitin
in
50 mM Tris 150mM NaCl 0.5 mM EDTA, pH 7.5
were collected
on the
5C beam line
at the Pohang Accelerator Laboratory storage ring
(Pohang, South Korea)
using a ADSC Quantum 315 detector
at a sample-detector distance of 1.4 m and
at a wavelength of λ = 1.907 nm
(I(s) vs s, where s = 4πsinθ/λ, and 2θ is the scattering angle).
Solute concentrations ranging between 0.5 and 1.8 mg/ml were measured
.
Five successive
60 second frames were collected.
The data were normalized to the intensity of the transmitted beam and radially averaged; the scattering of the solvent-blank was subtracted.
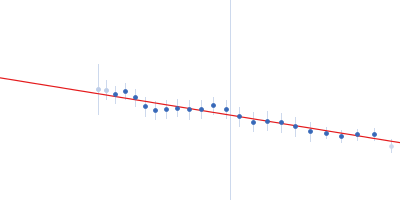
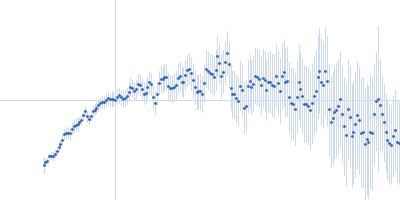
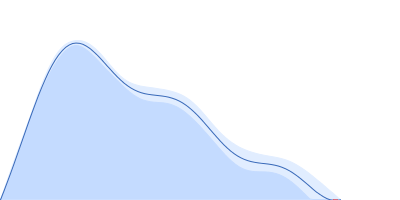
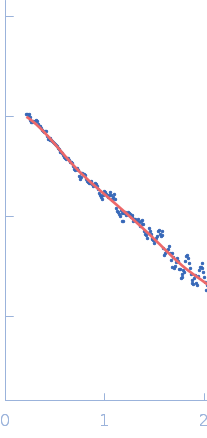
Note: The displayed results show a merged data set derived from a concentration series. Data were normalised to protein concentration and the high angle data from highest concentration and low angle data from lowest concentration were merged to generate final SAXS profile. Because of the flexibility of linear-tetraubiquitin molecule, ensemble optimisation method, EOM, was performed. The models shown above are two tetraubiquitin examples from the final EOM output. All EOM models, the radius of gyration distribution and maximum particle dimension distribution can be found in the full entry zip archive.
|
|
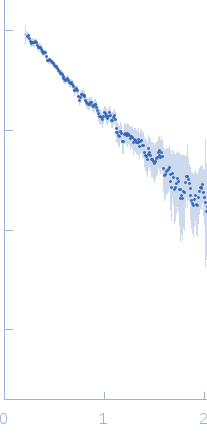 s, nm-1
 Rg, nm