|
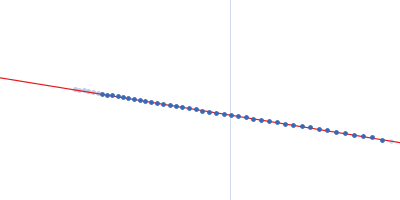
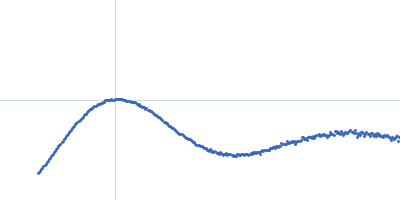
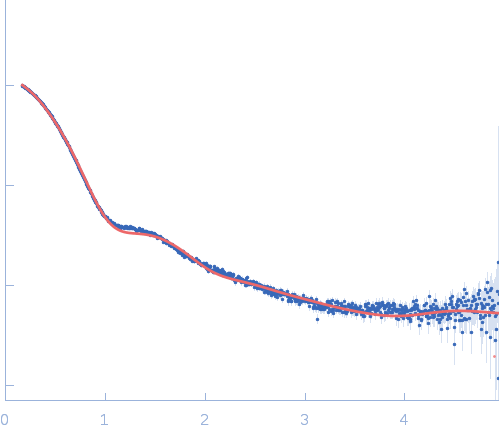
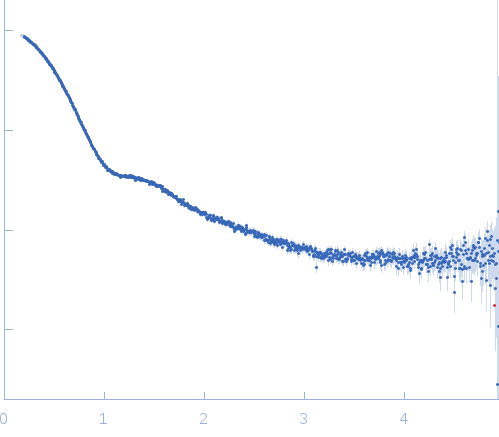
Synchrotron SAXS data from solutions of TET12(1.10)S-f5b in 20 mM Tris, 150 mM NaCl, 10% glycerol, pH 7.5, were collected at the BM29 beam line at the ESRF storage ring (Grenoble, France) using a Pilatus 1M detector at a sample-detector distance of 2.89 m and at a wavelength of λ = 0.1 nm (I(s) vs s, where s = 4πsinθ/λ, where 2θ is the scattering angle). A solute concentration series ranging between 1 and 7 mg/ml were measured at 20°C. For each sample, data was collected over 10 frames lasting 2 s. The data were normalized to the intensity of the transmitted beam and radially averaged. Each individual frames were carefully inspected for radiation damage and those not showing any radiation damage were then averaged. The scattering of the matched solvent-blank was subtracted and the different curves were scaled for protein concentration. The protein did not exhibit any concentration dependent effects, therefore the curve measured for the sample with the highest concentration was used for subsequent analysis. Scattering curves were analyzed using PRIMUS software.
|
|
TET12(1.10)S-f5b
|
| Mol. type |
|
Protein |
| Organism |
|
synthetic construct |
| Olig. state |
|
Monomer |
| Mon. MW |
|
53.2 kDa |
| Sequence |
|
FASTA |
| |
|
 s, nm-1