Melková K,
Zapletal V
Jansen S,
Nomilner E,
Zachrdla M,
Hritz J,
Nováček J,
Zweckstetter M,
Jensen MR,
Blackledge M,
Žídek L,
J Biol Chem
293(34):13297-13309
(2018)
Europe PMC
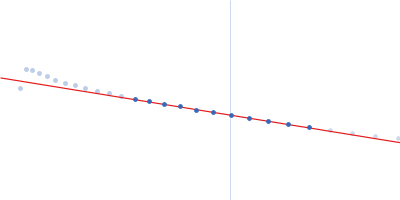
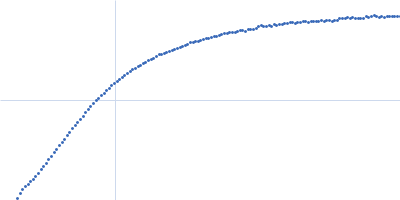
SASDD62 – Microtubule associated protein MAP2c (isoform 3); 12 mg/ml
Dmax unknown – experimental data range validation not possible.
There are no models related to this curve.
Synchrotron SAXS data from solutions of microtubule associated protein MAP2c (isoform 3) in 50 mM MOPS, 150 mM NaCl, 0,03% NaN3, pH 6.9 were collected on the BM29 beam line at the ESRF (Grenoble, France) using a Pilatus 1M detector at an X-ray wavelength, λ, of 0.099 nm (I(s) vs s, where s = 4πsinθ/λ and 2θ is the scattering angle). One solute concentration of 12.00 mg/ml was measured at 20°C. A total of 10 successive 1 s data frames were collected. The data were normalized to the intensity of the transmitted beam and radially averaged; the scattering of the solvent-blank was subtracted and the data were scaled for protein concentration.
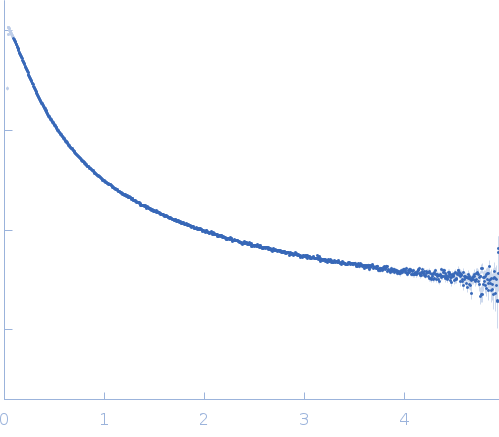 s, nm-1