Grinter R
Hay ID,
Song J,
Wang J,
Teng D,
Dhanesakaran V,
Wilksch JJ,
Davies MR,
Littler D,
Beckham SA,
Henderson IR,
Strugnell RA,
Dougan G,
Lithgow T,
PLoS Biol
16(8):e2006026
(2018)
Europe PMC
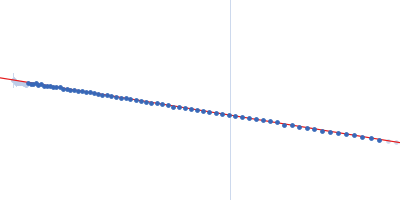
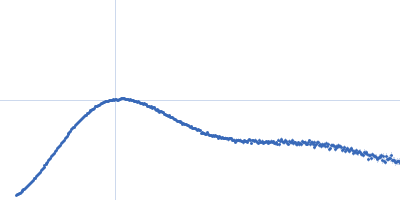
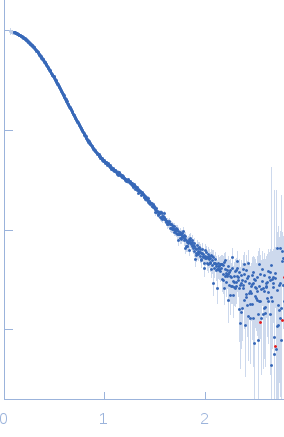
Synchrotron SAXS data, I(s) vs s (s = 4π sin θ/λ, where 2θ is the scattering angle) were collected from a sample of ferredoxin protease, FusC, using continuous-flow size-exclusion chromatography SAXS (SEC-SAXS) at the SAXS/WAXS beam line at the Australian Synchrotron (Melbourne, Australia). Data were collected a using a Pilatus 1M detector at a sample-detector distance of 2.7 m and at a wavelength of λ = 0.103 nm. The SEC mobile phase consisted of 20 mM Tris, 150 mM NaCl, 0.03 % NaN3, 5.0 % v/v glycerol, pH 7.8, (20°C). The SAXS data data measured from the SEC-elution (sample peak and buffer) were normalized to the intensity of the transmitted beam and radially averaged. The data from the sample SEC-peak were scaled and averaged and the scattering of the solvent-blank was subtracted from the sample frames to produce the data displayed in this entry.
 s, nm-1