Solution model of the intrinsically disordered polyglutamine tract-binding protein-1.

Rees M, Gorba C, de Chiara C, Bui TT, Garcia-Maya M, Drake AF, Okazawa H, Pastore A, Svergun D, Chen YW, Biophys J 102(7):1608-16 (2012) Europe PMC

SASDED2 – Polyglutamine tract-binding protein 1 (PQBP-1)

Polyglutamine-binding protein 1
MWI(0) 30 kDa
MWexpected 31 kDa
VPorod 51 nm3
log I(s) 4.04×101 4.04×100 4.04×10⁻¹ 4.04×10⁻²
Polyglutamine-binding protein 1 small angle scattering data  s, nm-1
ln I(s)
Polyglutamine-binding protein 1 Guinier plot ln 4.05×101 Rg: 3.7 nm 0 (3.7 nm)-2 s2
(sRg)2I(s)/I(0)
Polyglutamine-binding protein 1 Kratky plot 1.104 0 3 sRg
p(r)
Polyglutamine-binding protein 1 pair distance distribution function Rg: 3.8 nm 0 Dmax: 13 nm

Data validation


Fits and models


log I(s)
 s, nm-1
Polyglutamine tract-binding protein 1 (PQBP-1) Rg histogram Rg, nm

log I(s)
 s, nm-1
Polyglutamine-binding protein 1 DAMMIF model

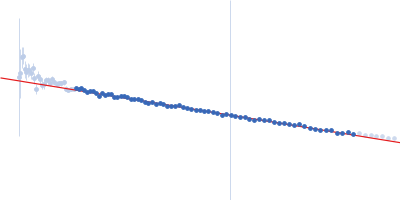
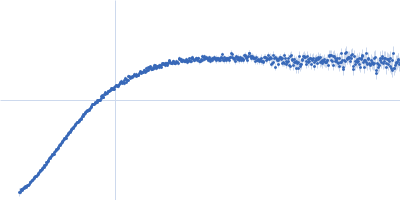
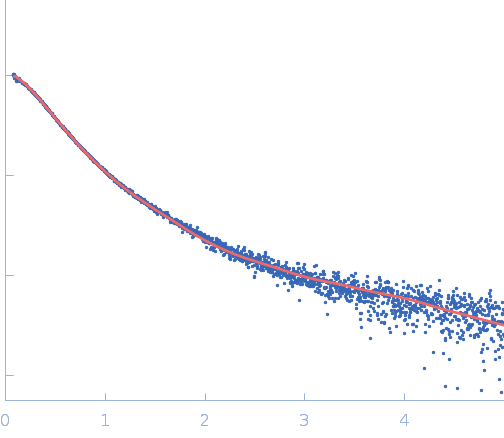
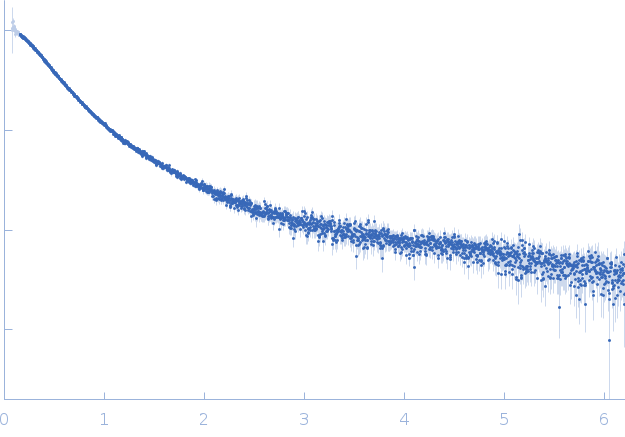
Synchrotron SAXS data from solutions of polyglutamine tract-binding protein 1 (PQBP-1) in 20 mM Tris, 150 mM NaCl, 1mM DTT, pH 7 were collected on the EMBL X33 beam line at DORIS III (Hamburg, Germany) using a Pilatus 1M-W detector at a sample-detector distance of 2.7 m and at a wavelength of λ = 0.15 nm (l(s) vs s, where s = 4πsinθ/λ, and 2θ is the scattering angle). Solute concentrations ranging between 7 and 13 mg/ml were measured at 20°C. Eight successive 15 second frames were collected. The data were normalized to the intensity of the transmitted beam and radially averaged; the scattering of the solvent-blank was subtracted. The low angle data collected at lower concentration were merged with the highest concentration high angle data to yield the final composite scattering curve.
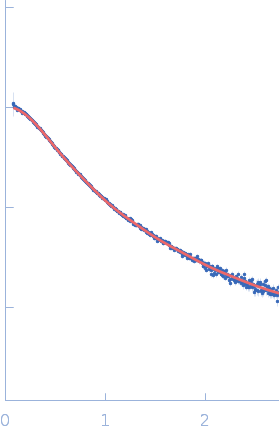
Tags: idp X33
Polyglutamine-binding protein 1 (PQBP-1)
Mol. type   Protein
Organism   Homo sapiens
Olig. state   Monomer
Mon. MW   30.6 kDa
 
UniProt   O60828 (1-265)
Sequence   FASTA