|
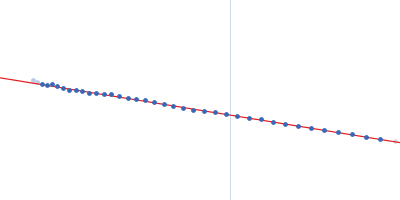
Synchrotron SAXS data from solutions of Protein tyrosine phosphatase SHP2 in 50 mM ADA, 2 mM TCEP, pH 6.5 were collected on the BL4-2 beam line at the Stanford Synchrotron Radiation Lightsource (SSRL; Stanford, CA, USA) using a Rayonix MX225-HE detector at a sample-detector distance of 1.7 m and at a wavelength of λ = 0.1127 nm (l(s) vs s, where s = 4πsinθ/λ, and 2θ is the scattering angle). Solute concentrations ranging between 0.9 and 14.2 mg/ml were measured at 20°C. 10 successive 1 second frames were collected. The data were normalized to the intensity of the transmitted beam and radially averaged; the scattering of the solvent-blank was subtracted. The low angle data collected at lower concentration were merged with the highest concentration high angle data to yield the final composite scattering curve.
|
|
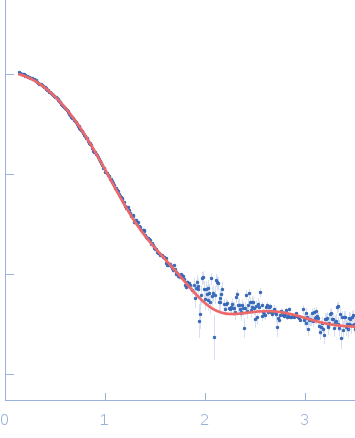
 s, nm-1
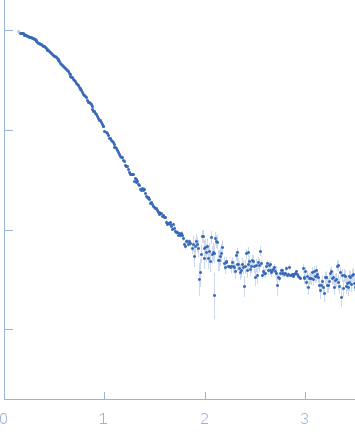