Comment on the Optimal Parameters to Derive Intrinsically Disordered Protein Conformational Ensembles from Small-Angle X-ray Scattering Data Using the Ensemble Optimization Method

Sagar A, Jeffries C, Petoukhov M, Svergun D, Bernadó P, Journal of Chemical Theory and Computation (2021) DOI

SASDHH8 – Histatin 5 (Histatin 3; His3-(20-43)-peptide) at 1.26 mg/ml in 20 mM Tris 150 mM NaCl pH 7.0, 298 K

Histatin-3, His3-(20-43)-peptide
MWI(0) 3 kDa
MWexpected 3 kDa
VPorod 3 nm3
log I(s) 2.84×10⁻³ 2.84×10⁻⁴ 2.84×10⁻⁵ 2.84×10⁻⁶
Histatin-3, His3-(20-43)-peptide small angle scattering data  s, nm-1
ln I(s)
Histatin-3, His3-(20-43)-peptide Guinier plot ln 2.84×10⁻³ Rg: 1.5 nm 0 (1.5 nm)-2 s2
(sRg)2I(s)/I(0)
Histatin-3, His3-(20-43)-peptide Kratky plot 1.104 0 3 sRg
p(r)
Histatin-3, His3-(20-43)-peptide pair distance distribution function Rg: 1.5 nm 0 Dmax: 6 nm

Data validation


There are no models related to this curve.

Synchrotron SAXS data from solutions of Histatin 5 in 20 mM Tris, 150 mM NaCl, pH 7 were collected on the EMBL P12 beam line at PETRA III (DESY, Hamburg, Germany) using a Pilatus 6M detector at a sample-detector distance of 3 m and at a wavelength of λ = 0.124 nm (I(s) vs s, where s = 4πsinθ/λ, and 2θ is the scattering angle). One solute concentration of 1.26 mg/ml was measured at 25°C. 30 successive 0.100 second frames were collected. The data were normalized to the intensity of the transmitted beam and radially averaged; the scattering of the solvent-blank was subtracted.

The data are the combined results from nine replicates and are normalised to protein concentration. The concentration independent MW estimate is 3.8 kDa in the credibility interval 3.3-4.1 kDa.
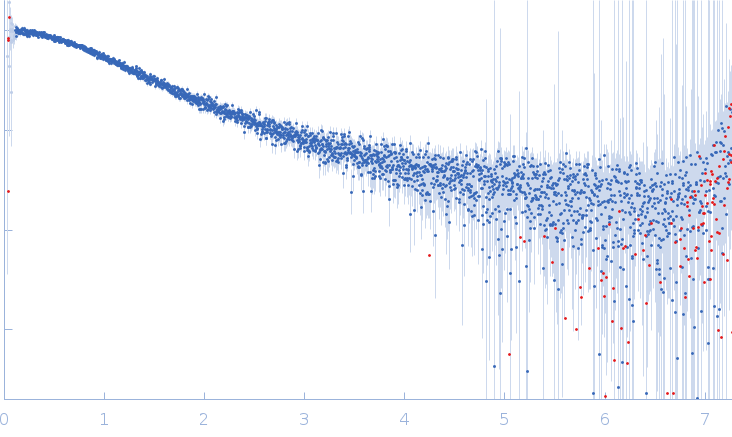
Tags: idp
Histatin-3, His3-(20-43)-peptide (Histatin 5)
Mol. type   Protein
Organism   Homo sapiens
Olig. state   Monomer
Mon. MW   3.0 kDa
 
UniProt   P15516 (20-43)
Sequence   FASTA