O'Carroll I,
Fan L
Kroupa T,
McShane E,
Theodore C,
Yates E,
Kondrup B,
Ding J,
Martin T,
Rein A,
Wang Y,
Journal of Molecular Biology
432(24):166711
(2020)
DOI
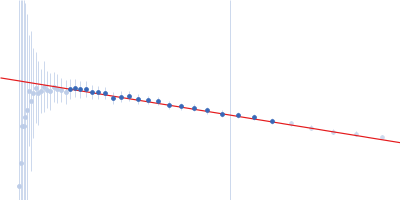
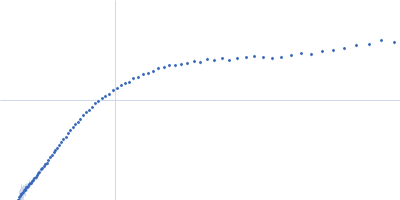
Synchrotron SAXS data from solutions of full-length HERV-K Rec response element in 10mM Tris-HCl, 100mM KCl, and 0.5mM MgCl₂, pH 8 were collected on the 12ID-B SAXS/WAXS beam line at the Advanced Photon Source (APS), Argonne National Laboratory (Lemont, IL, USA) using a Pilatus 2M detector at a sample-detector distance of 1.9 m and at a wavelength of λ = 0.0932 nm (I(s) vs s, where s = 4πsinθ/λ, and 2θ is the scattering angle). Solute concentrations ranging between 0.8 and 1.3 mg/ml were measured at 20°C. 30 successive 2 second frames were collected. The data were normalized to the intensity of the transmitted beam and radially averaged; the scattering of the solvent-blank was subtracted. The low angle data collected at lower concentrations were extrapolated to infinite dilution and merged with the higher concentration data to yield the final composite scattering curve.
Volume of correlation, Vc, was used to estimate the molecular weight.
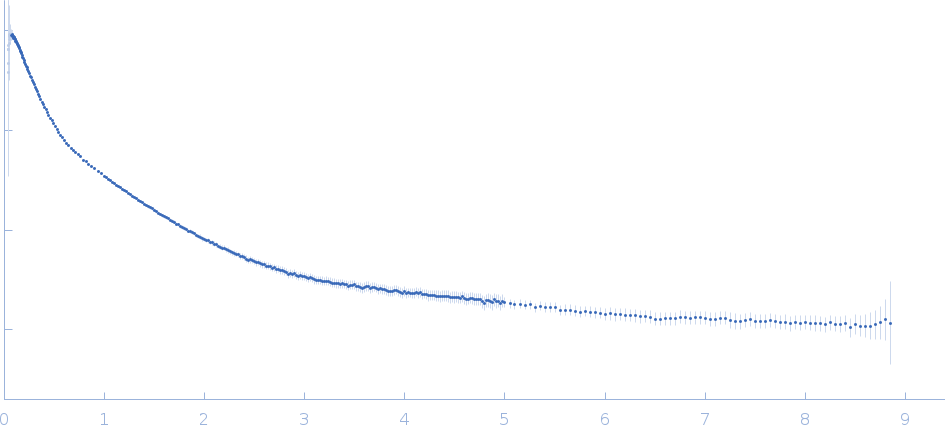 s, nm-1