| MWexperimental | 144 | kDa |
| MWexpected | 148 | kDa |
| VPorod | 271 | nm3 |
|
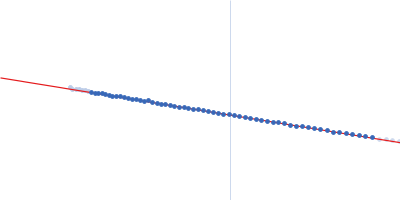
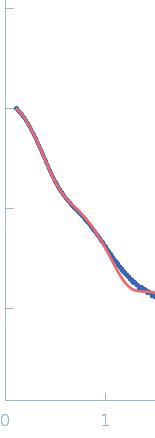
log I(s)
9.98×10⁻¹
9.98×10⁻²
9.98×10⁻³
9.98×10⁻⁴
|
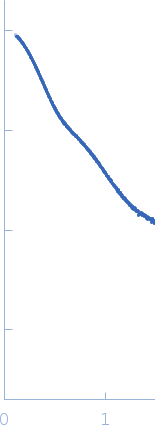 s, nm-1
|
|
|
|
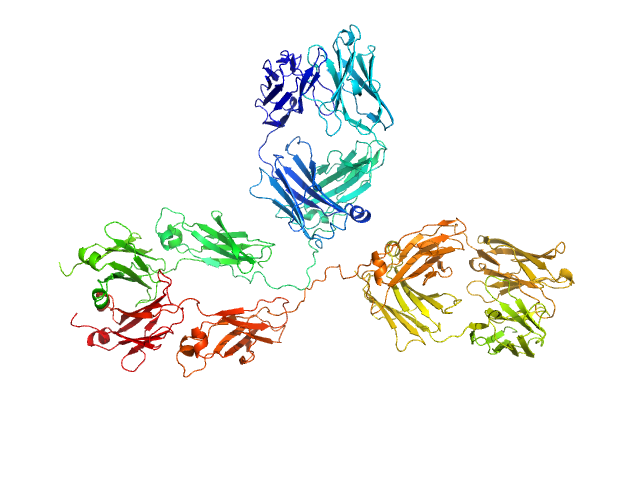
|
|
Synchrotron SAXS
data from solutions of
Immunoglobulin G1 (IgG1) Deglycosylated
in
20 mM L-histidine, 138 mM NaCl, and 2.6 mM KCl buffer, pH 6
were collected
on the
B21 beam line
at the Diamond Light Source storage ring
(Didcot, UK)
using a Pilatus 2M detector
at a sample-detector distance of 4 m and
at a wavelength of λ = 0.12 nm
(I(s) vs s, where s = 4πsinθ/λ, and 2θ is the scattering angle).
One solute concentration of 4.29 mg/ml was measured
at 20°C.
30 successive
30 second frames were collected.
The data were normalized to the intensity of the transmitted beam and radially averaged; the scattering of the solvent-blank was subtracted.
|
|
|||||||||||||||||||||