|
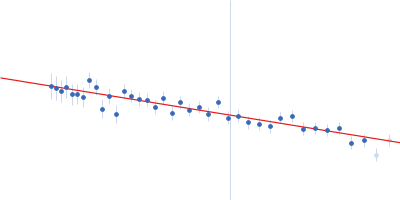
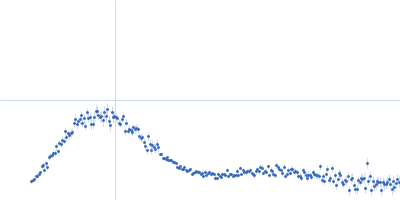
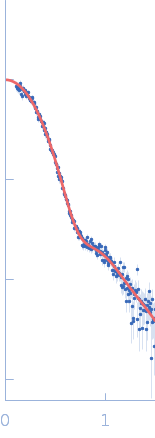
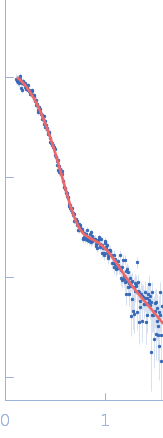
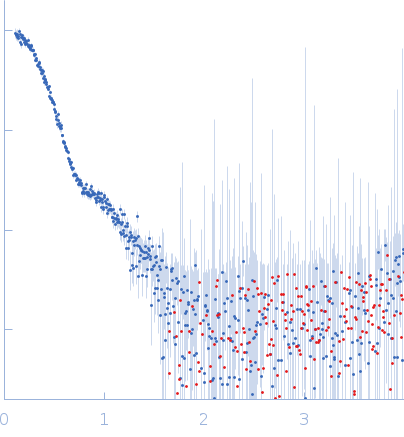
SAXS data from solutions of wild-type α-L-Fucosidase isoenzyme 2 in 50 mM potassium phosphate, pH 7.4 were collected using an Anton Paar SAXSpoint 2.0 instrument (Institute of Biotechnology, Czech Academy of Sciences, Vestec, Czech Republic) equipped with an Eiger R 1M detector at a sample-detector distance of 0.8 m and at a wavelength of λ = 0.134 nm (I(s) vs s, where s = 4πsinθ/λ, and 2θ is the scattering angle). Solute concentrations ranging between 0.8 and 5.7 mg/ml were measured at 15°C. 15 successive 60 second frames were collected. The data were normalized to the intensity of the transmitted beam and radially averaged; the scattering of the solvent-blank was subtracted. The low angle data collected at lower concentration were merged with the highest concentration high angle data to yield the final composite scattering curve.
Storage temperature = UNKNOWN
|
|
Alpha-L-fucosidase
(Fuk2 wt)
|
| Mol. type |
|
Protein |
| Organism |
|
Paenibacillus thiaminolyticus (Bacillus thiaminolyticus) |
| Olig. state |
|
Tetramer |
| Mon. MW |
|
74.3 kDa |
| |
| UniProt |
|
K0JCW6
(1-660)
|
| Sequence |
|
FASTA |
| |
|
 s, nm-1