Structures of the interleukin 11 signalling complex reveal gp130 dynamics and the inhibitory mechanism of a cytokine variant

Metcalfe R Hanssen E, Fung K, Aizel K, Kosasih C, Zlatic C, Doughty L, Morton C, Leis A, Parker M, Gooley P, Putoczki T, Griffin M, Nature Communications 14(1) (2023) DOI

SASDLR3 – Interleukin 11 Mutein

Interleukin 11 Mutein
MWexperimental 17 kDa
MWexpected 18 kDa
VPorod 25 nm3
log I(s) 6.62×10⁻³ 6.62×10⁻⁴ 6.62×10⁻⁵ 6.62×10⁻⁶
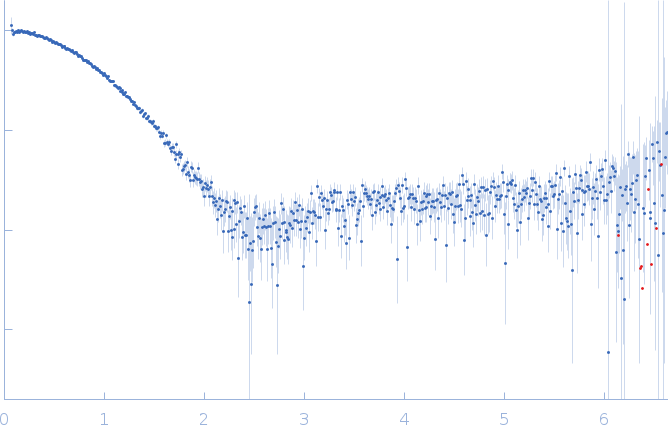
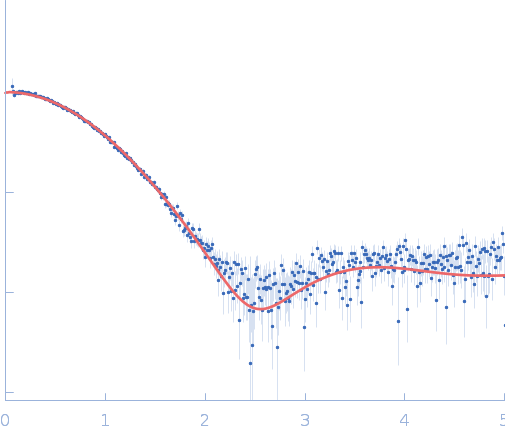
Interleukin 11 Mutein small angle scattering data  s, nm-1
ln I(s)
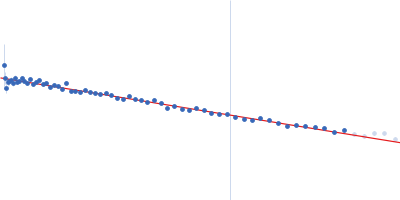
Interleukin 11 Mutein Guinier plot ln 6.62×10⁻³ Rg: 1.8 nm 0 (1.8 nm)-2 s2
(sRg)2I(s)/I(0)
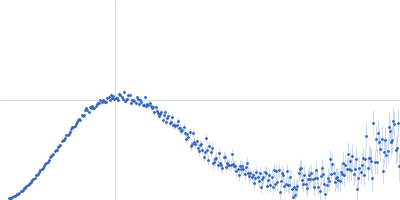
Interleukin 11 Mutein Kratky plot 1.104 0 3 sRg
p(r)
Interleukin 11 Mutein pair distance distribution function Rg: 1.8 nm 0 Dmax: 5.4 nm

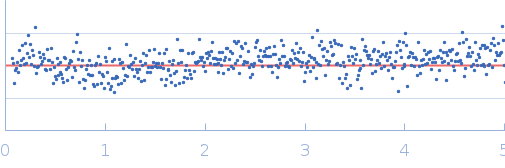
Data validation


Fits and models


log I(s)
 s, nm-1
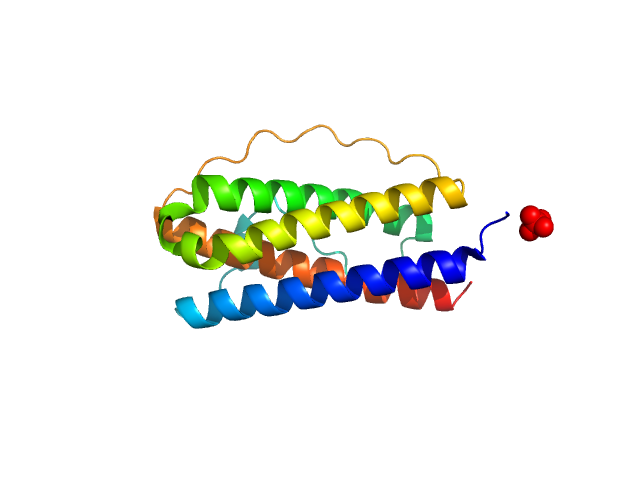
Interleukin 11 Mutein OTHER model

Synchrotron SAXS data from solutions of Interleukin 11 Mutein in 20 mM Tris, 150 mM NaCl, 0.2% sodium azide, pH 8.5 were collected on the SAXS/WAXS beam line at the Australian Synchrotron storage ring (Melbourne, Australia) using a Pilatus3 S 2M detector at a sample-detector distance of 3.5 m and at a wavelength of λ = 0.108 nm (I(s) vs s, where s = 4πsinθ/λ, and 2θ is the scattering angle). In-line size-exclusion chromatography (SEC) SAS was employed. The SEC parameters were as follows: A sample at 5 mg/ml was injected at a 0.45 ml/min flow rate onto a GE Superdex 200 Increase 10/300 column at 22°C. Nine successive 1 second frames were collected. The data were normalized to the intensity of the transmitted beam and radially averaged; the scattering of the solvent-blank was subtracted.

Sample injection volume = UNKNOWN

Interleukin 11 Mutein
Mol. type   Protein
Organism   Homo sapiens
Olig. state   Monomer
Mon. MW   18.3 kDa
Sequence   FASTA
 
PDB ID   8DPW