|
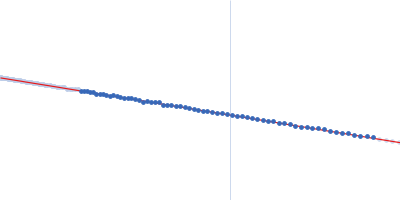
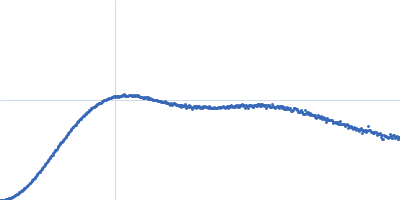
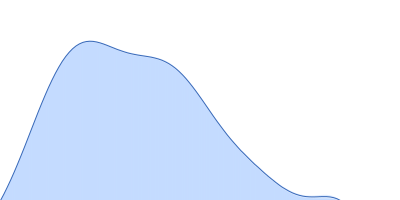
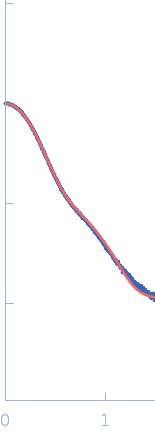
Synchrotron SAXS data from solutions of glycosylated immunoglobulin G4 (IgG4) in 20 mM L-histidine, 138 mM NaCl, and 2.6 mM KCl buffer, pH 6 were collected on the B21 beam line at the Diamond Light Source (Didcot, UK) using a Pilatus 2M detector at a sample-detector distance of 4 m and at a wavelength of λ = 0.12 nm (I(s) vs s, where s = 4πsinθ/λ, and 2θ is the scattering angle). One solute concentration of 2.79 mg/ml was measured at 20°C. 30 successive 30 second frames were collected. The data were normalized to the intensity of the transmitted beam and radially averaged; the scattering of the solvent-blank was subtracted.
The data displayed in this entry are interpolated SAXS profile representations extrapolated to s = 0 and I(0) = 1. CAUTION: Errors associated with the scattering data points are not available.
|
|
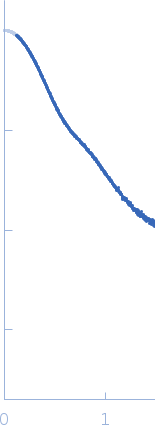 s, nm-1