|
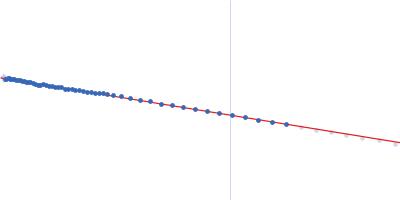
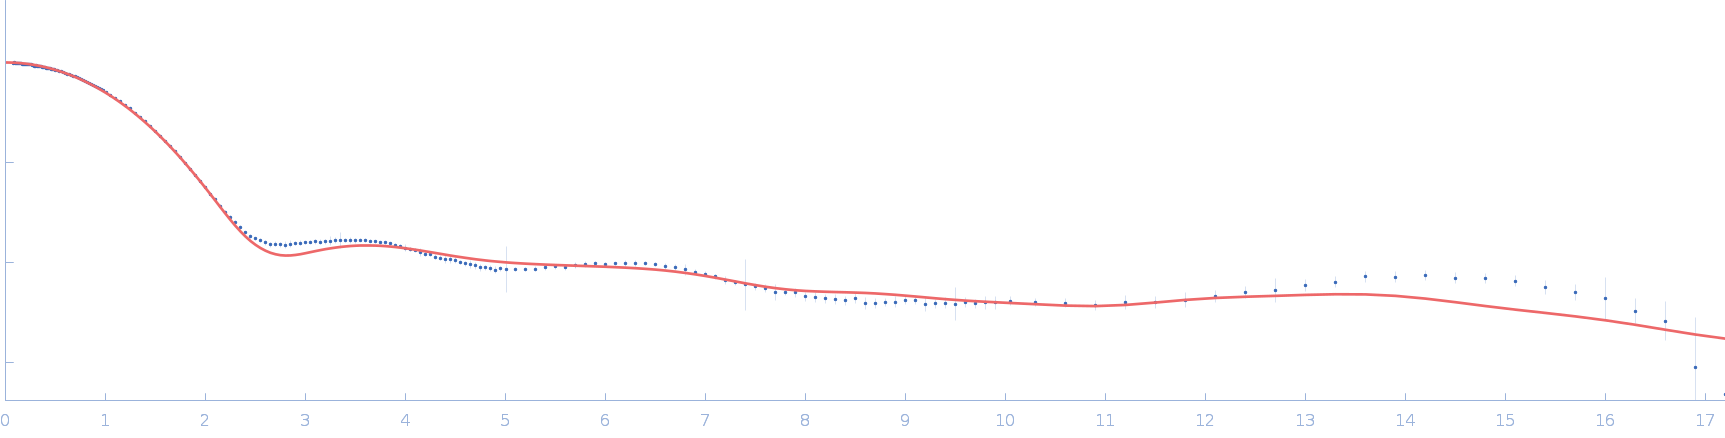
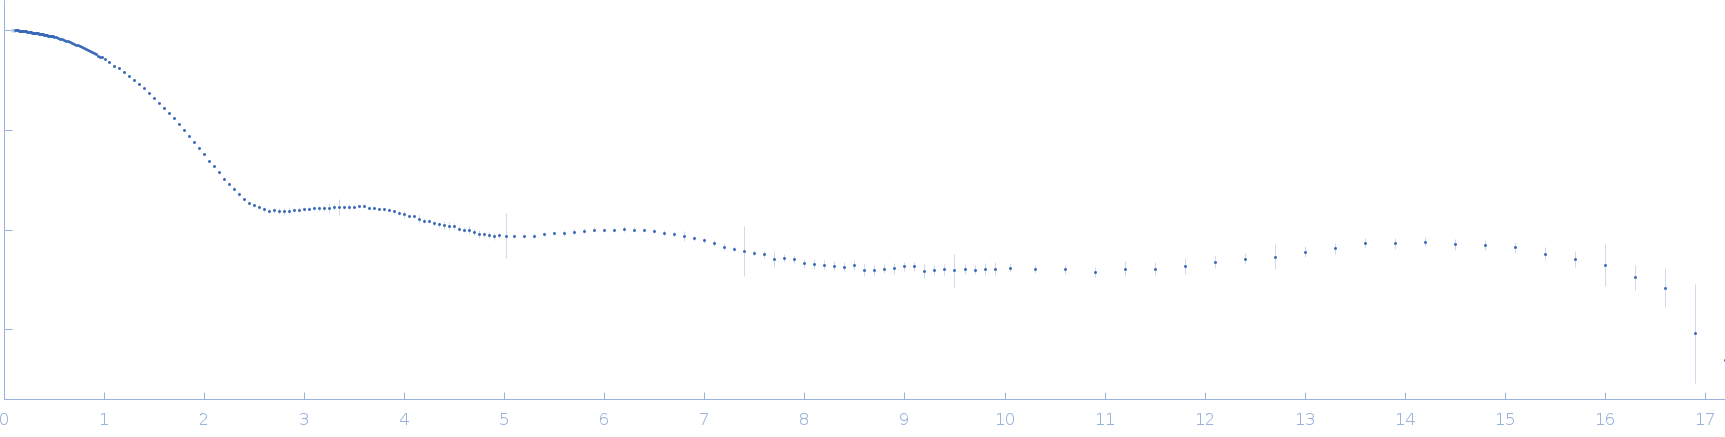
Synchrotron SAXS data from solutions lysozyme in 40 mM NaOAc pH 3.8, 150 mM NaCl, pH 3.8 were collected on the X9A beam line at the National Synchrotron Light Source (NSLS) storage ring (Brookhaven, NY, USA) using a Pilatus 300K detector at a wavelength of λ = 0.129 nm (I(s) vs s, where s = 4πsinθ/λ, and 2θ is the scattering angle). One solute concentration of 2.50 mg/ml was measured at 10°C. Three successive 30 second frames were collected. The data were normalized to the intensity of the transmitted beam and radially averaged; the scattering of the solvent-blank was subtracted.
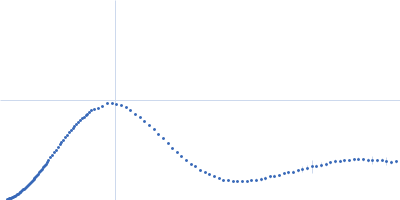
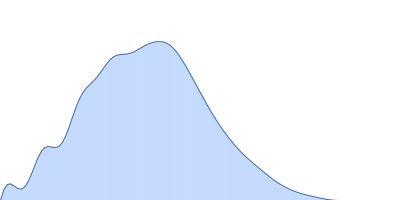
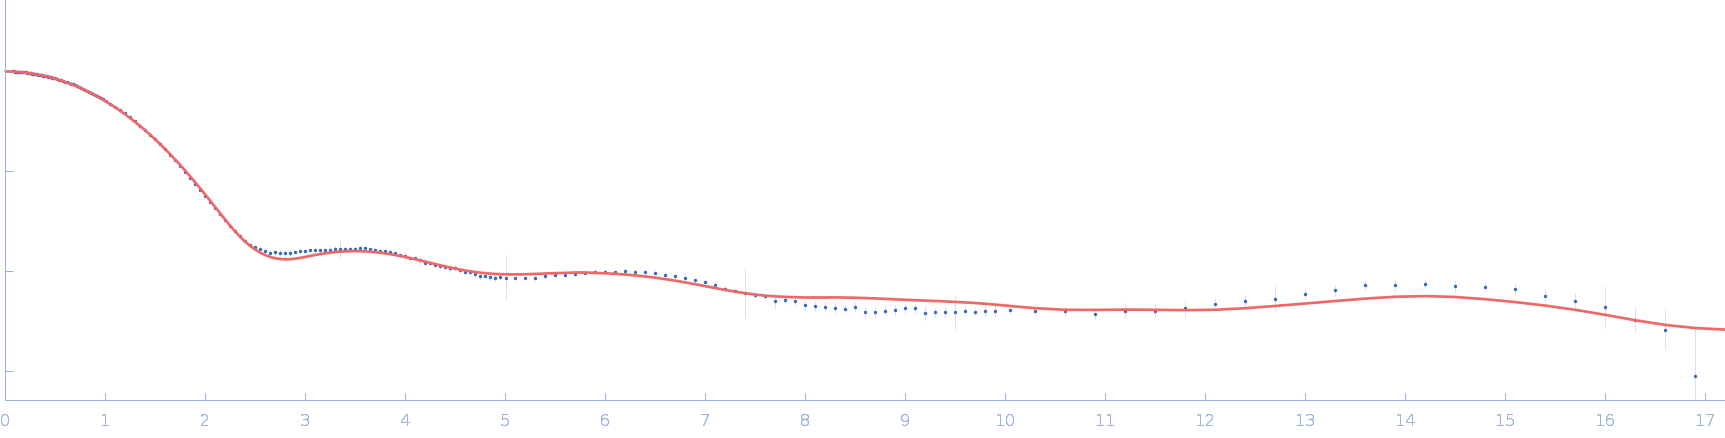
Please refer to publication entitled same as this project. Lysozyme solutions were prepared as published earlier (Sharma et al. 2016). Only differential step was that eluted protein samples from gel filtration chromatography were not concentrated. Different portions of single peak were collected, pooled and protein concentrations were estimated using extinction coefficient of 2.5 for 1 mg/ml of lysozyme (mass over mass dilutions were done to have final absorbance values between 0.5 to 1 units at 280 nm). Buffer eluting from columns when no proteins were eluting were used as matched buffer for SWAXS experiments. All samples and matched buffer were stored at 10°C till data collection. Scattering experiments mentioned here were done at X9 Beamline of National Synchrotron Light Source, Brookhaven National Lab NY USA under PASS proposal system in May 2014 to PI for different solution SAXS experiments. X-rays with wavelength 0.129 nm were utilized, and samples or buffer were flown through a capillary at flow rate of 60 µl/min. The sample stage holding the capillary was maintained at 10°C using connected water circulator. Three exposures of 30 seconds were simultaneously captured on two CCD detectors, one for SAXS and another (tilted) for WAXS data. Using Python based programs, the SAXS and WAXS files were averaged, scaled, and merged to obtain SWAXS datasets. Taking example of data for 2 mg/ml sample (as it represents average concentration of protein samples), sequential steps involved in processing i.e. averaging, scaling, merging and buffer subtraction have been shown in Supplementary Figure S1 of the paper. SAXS and WAXS data collected was from 0.08-2.4 nm-1 and 1-19.9 nm-1, respectively, and during merging, overlap of data in the s range from 1-2.4 nm-1 was utilized. Again taking files for sample with 2 mg/ml concentration and its matched buffer, differences in intensity values at s values used during averaging of three frames for SAXS or WAXS data and subsequent merging have been shown in Supplementary Figure S2 of the paper. In all datasets including buffer, the scale factor applied to WAXS data was about 0.025-0.03 keeping SAXS portion of data at unity. Post-processing, we obtained variation in SWAXS Intensity profiles, I(s) as a function of s where s is defined as in Eq. 1 and units are in nm-1. Kratky analysis, Guinier analysis and residual mapping of the fits were done using ATSAS suite of programs version 3.0.1. Computed or estimated intensity profiles were compared with experimental data using same program. Distance distribution profiles of the interatomic vectors, P(r) were estimated using GNOM program integrated within ATSAS suite (Svergun 1992; Franke et al. 2017). Deconvolution of the multiple peaks in the estimated P(r) profiles was done using Origin Software v 5.0.
|
|
 s, nm-1