| MWexperimental | 14 | kDa |
| MWexpected | 14 | kDa |
|
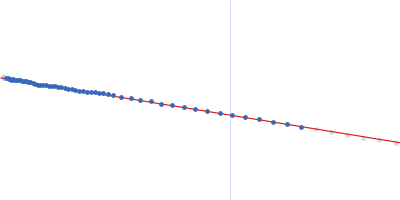
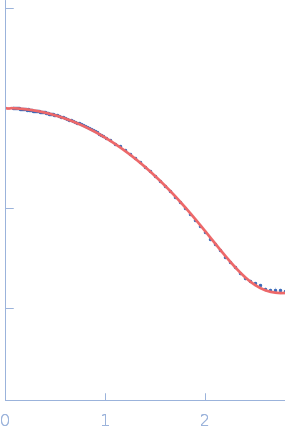
log I(s)
2.47×10²
2.47×101
2.47×100
2.47×10⁻¹
|
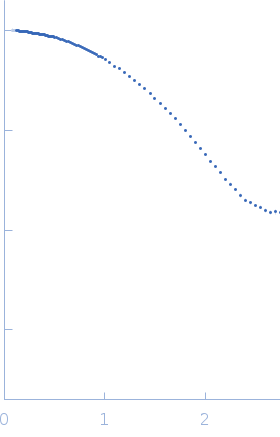 s, nm-1
|
|
|
|


|
|

|
|

|
|
Synchrotron SAXS data from solutions lysozyme in 40 mM NaOAc pH 3.8, 150 mM NaCl, pH 3.8 were collected on the X9A beam line at the National Synchrotron Light Source (NSLS) storage ring (Brookhaven, NY, USA) using a Pilatus 300K detector at a wavelength of λ = 0.129 nm (I(s) vs s, where s = 4πsinθ/λ, and 2θ is the scattering angle). Solute concentrations ranging between 0.9 and 5 mg/ml were measured at 10°C. Three successive 30 second frames were collected. The data were normalized to the intensity of the transmitted beam and radially averaged; the scattering of the solvent-blank was subtracted.
Please refer to publication entitled same as this project for details on how this dataset was generated by averaging concentration series. |
|
|||||||||||||||||||||||||||||||||