|
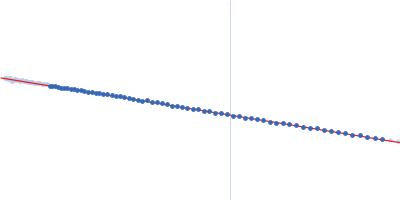
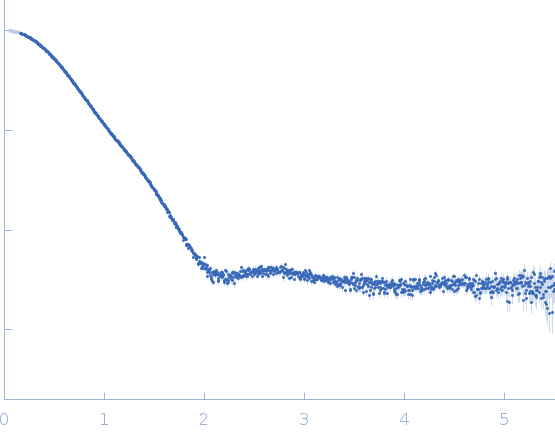
Synchrotron SEC-SAXS data were collected at the SWING beamline of the SOLEIL Synchrotron (Saint-Aubin, France). Measurements were performed using a size-exclusion HPLC column Bio Sec3 Agilent, on-line with the SAXS measuring cell, a 1.5 mm diameter quartz capillary contained in an evacuated vessel. The sample-to-detector (Eiger 4M Dectris) distance was set to 2000 mm and the wavelength λ to 0.1 nm, allowing useful data collection over the momentum transfer range of 0.05 nm−1 < s < 5.5 nm−1.
SAXS data were collected directly after elution of the AIP56 protein through the HPLC column equilibrated in 50 mM Hepes Buffer (pH 7.5), NaCl 500 mM. 50 µl of protein sample were injected at 15 °C at two different initial concentrations, 13.4 and 3.2 mg/ml, in order to obtain a resulting curve with a improved counting statistics and without significant/measurable interparticle interactions. The SEC column flow rate was 0.2 ml/min, and the data were collected as a set of 0.99 s frames throughout the SEC-elution with a dead time between frames of 0.01 sec. Scattering from the elution buffer before the void volume was recorded and used as buffer scattering for subtraction from the protein-sample scattering patterns. The scattering intensities were placed on an absolute scale relative to the scattering from water. Data were first analyzed using Foxtrot, the Swing in-house software, and then using the US-SOMO HPLC module. Identical frames under the main elution peak were selected using Cormap and averaged for further analysis. Both averaged curves corresponding to the two initial concentrations were merged.
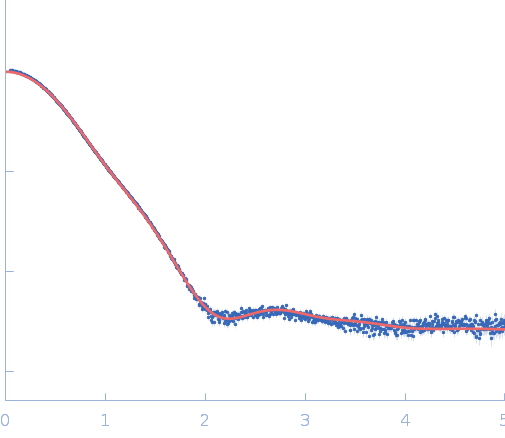
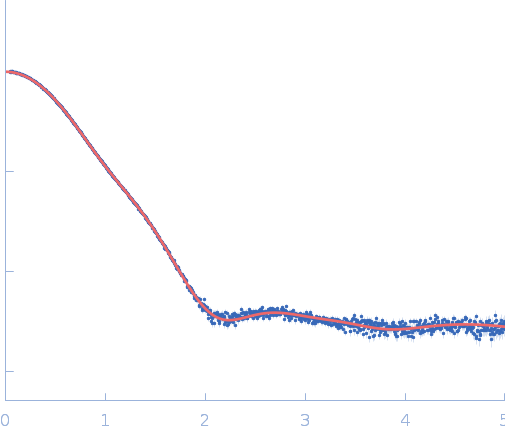
The two models displayed in this entry show the X-ray crystal structure fit to the data (top) and a model determined from normal-mode analysis (bottom).
|
|
 s, nm-1