Probing the conformational changes of in vivo overexpressed cell cycle regulator 6S ncRNA

Makraki E, Miliara S, Pagkalos M, Kokkinidis M, Mylonas E Fadouloglou V, Frontiers in Molecular Biosciences 10 (2023) DOI

SASDQR4 – Escherichia coli 6S RNA

6S RNA (SsrS gene)
MWI(0) 63 kDa
MWexpected 59 kDa
VPorod 175 nm3
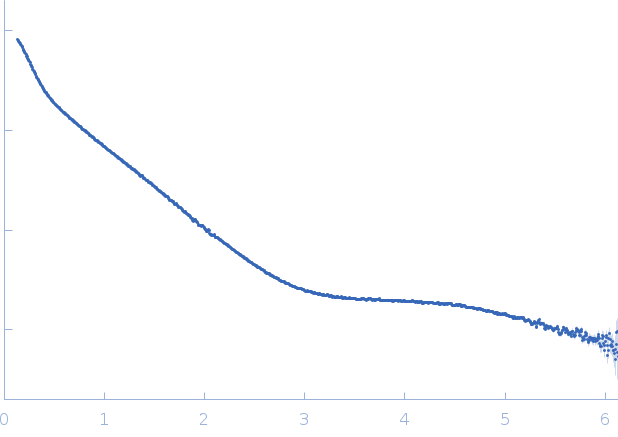
log I(s) 2.48×10⁻² 2.48×10⁻³ 2.48×10⁻⁴ 2.48×10⁻⁵
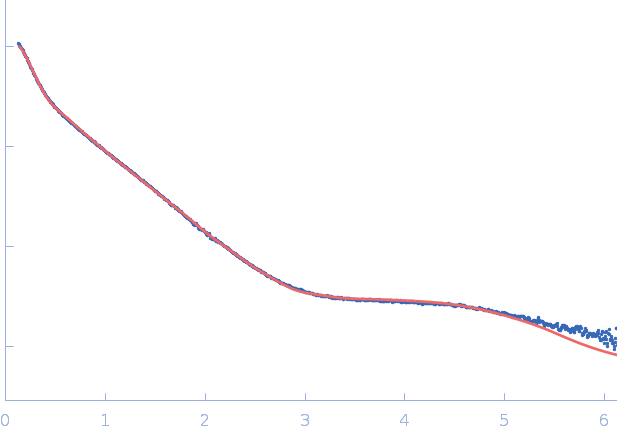
6S RNA (SsrS gene) small angle scattering data  s, nm-1
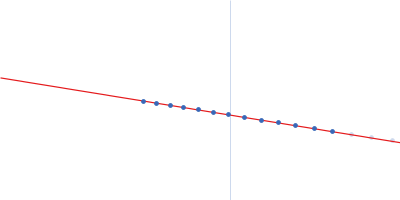
ln I(s)
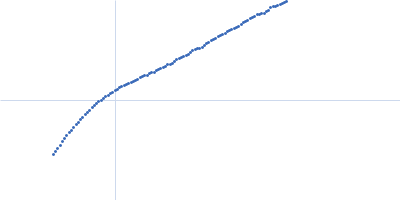
6S RNA (SsrS gene) Guinier plot ln 2.49×10⁻² Rg: 6.1 nm 0 (6.1 nm)-2 s2
(sRg)2I(s)/I(0)
6S RNA (SsrS gene) Kratky plot 1.104 0 3 sRg
p(r)
6S RNA (SsrS gene) pair distance distribution function Rg: 6.5 nm 0 Dmax: 24 nm

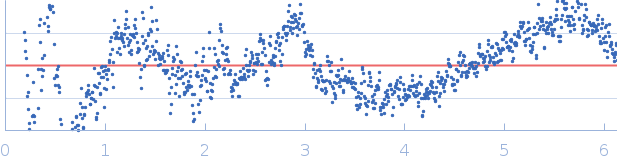
Data validation


Fits and models


log I(s)
 s, nm-1
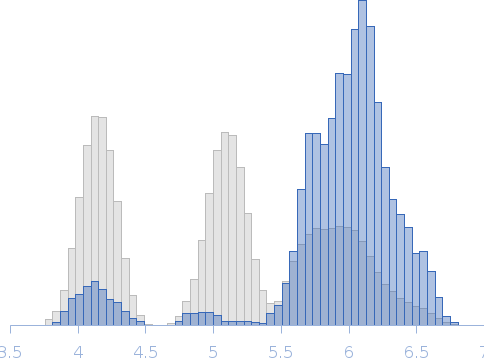
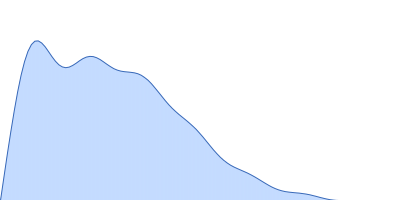
Escherichia coli 6S RNA Rg histogram Rg, nm
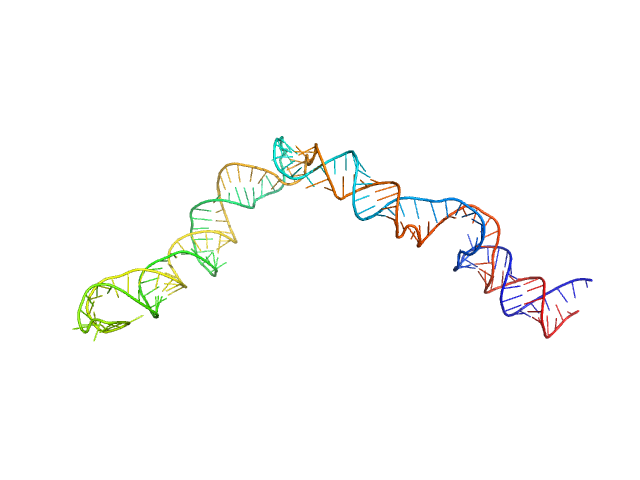
6S RNA (SsrS gene) EOM/RANCH model

Synchrotron SAXS data from solutions of Escherichia coli 6S RNA in 20 mM Tris-HCl, 200 mM KCl, 5 mM MgCl2, pH 8 were collected on the SWING beam line at SOLEIL (Saint-Aubin, France) using a AVIEX PCCD170170 detector at a sample-detector distance of 3.1 m and at a wavelength of λ = 0.1033 nm (I(s) vs s, where s = 4πsinθ/λ, and 2θ is the scattering angle). Solute concentrations ranging between 0.2 and 8 mg/ml were measured at 15°C. The data were normalized to the intensity of the transmitted beam and radially averaged; the scattering of the solvent-blank was subtracted. The low angle data collected at lower concentration were merged with the highest concentration high angle data to yield the final composite scattering curve.

X-ray Exposure time = UNKNOWN. Number of frames = UNKNOWN

6S RNA (SsrS gene)
Mol. type   RNA
Organism   Escherichia coli
Olig. state   Monomer
Mon. MW   58.9 kDa
Sequence   FASTA