Polyubiquitin ligand-induced phase transitions are optimized by spacing between ubiquitin units

Galagedera S Dao T, Enos S, Chaudhuri A, Schmit J, CastaƱeda C, Proceedings of the National Academy of Sciences 120(42) (2023) DOI

SASDRP7 – M1-linked tetraubiquitin Glu-Ala-Lys fusion, M1(1-74)-A(EA3K)3A-Ub4

Tetraubiquitin, M1(1-74)-A(EA3K)3A-Ub
MWI(0) 36 kDa
MWexpected 39 kDa
VPorod 62 nm3
log I(s) 1.65×10⁻² 1.65×10⁻³ 1.65×10⁻⁴ 1.65×10⁻⁵
Tetraubiquitin, M1(1-74)-A(EA3K)3A-Ub small angle scattering data  s, nm-1
ln I(s)
Tetraubiquitin, M1(1-74)-A(EA3K)3A-Ub Guinier plot ln 1.65×10⁻² Rg: 4.2 nm 0 (4.2 nm)-2 s2
(sRg)2I(s)/I(0)
Tetraubiquitin, M1(1-74)-A(EA3K)3A-Ub Kratky plot 1.104 0 3 sRg
p(r)
Tetraubiquitin, M1(1-74)-A(EA3K)3A-Ub pair distance distribution function Rg: 4.5 nm 0 Dmax: 18.2 nm

Data validation


There are no models related to this curve.

Synchrotron SAXS data from solutions of M1-linked tetraubiquitin Glu-Ala-Lys fusion, M1(1-74)-A(EA3K)3A-Ub4 in 20 mM sodium phosphate, 0.5 mM EDTA, 0.02 % NaN3, pH 6.8 were collected on the BioCAT 18ID beam line at the Advanced Photon Source (APS), Argonne National Laboratory storage ring (Lemont, IL, USA) using a Pilatus3 X 1M detector at a sample-detector distance of 3.7 m and at a wavelength of λ = 0.1033 nm 
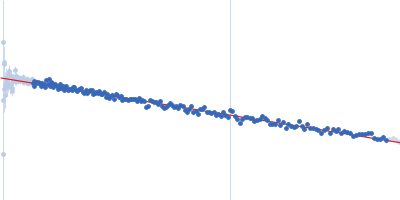
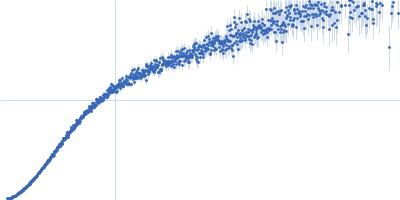
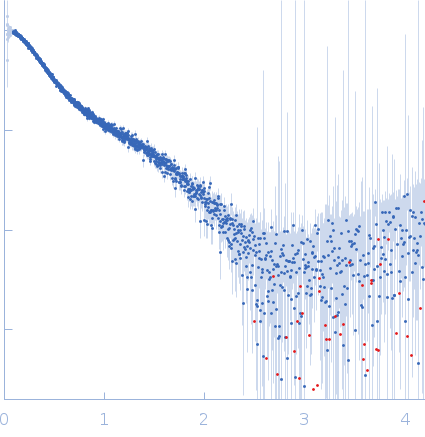
(I(s) vs s, where s = 4πsinθ/λ, and 2θ is the scattering angle). One solute concentration of 6.23 mg/ml was measured at 20°C. 10 successive 0.500 second frames were collected. The data were normalized to the intensity of the transmitted beam and radially averaged; the scattering of the solvent-blank was subtracted.

Tetraubiquitin, M1(1-74)-A(EA3K)3A-Ub (M1(1-74)-A(EA3K)3A)
Mol. type   Protein
Organism   synthetic construct
Olig. state   Monomer
Mon. MW   38.5 kDa
Sequence   FASTA