Conformational Disorder Analysis of the Conditionally Disordered Protein CP12 from Arabidopsis thaliana in Its Different Redox States

Del Giudice A Gurrieri L, Galantini L, Fanti S, Trost P, Sparla F, Fermani S, International Journal of Molecular Sciences 24(11):9308 (2023) DOI

SASDSN2 – AtCP12-2 in a reduced form

CP12-2 (D77G)
MWI(0) 10 kDa
MWexpected 8 kDa
VPorod 27 nm3
log I(s) 9.97×100 9.97×10⁻¹ 9.97×10⁻² 9.97×10⁻³
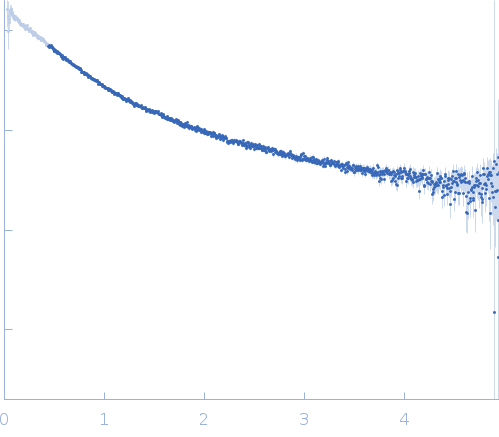
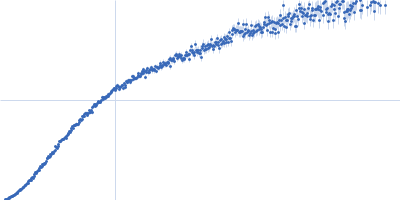
CP12-2 (D77G) small angle scattering data  s, nm-1
ln I(s)
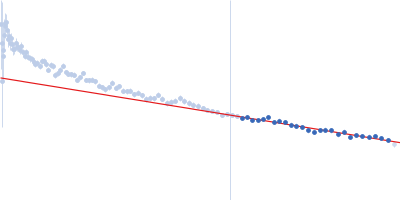
CP12-2 (D77G) Guinier plot ln 9.98×100 Rg: 2.3 nm 0 (2.3 nm)-2 s2
(sRg)2I(s)/I(0)
CP12-2 (D77G) Kratky plot 1.104 0 3 sRg
p(r)
CP12-2 (D77G) pair distance distribution function Rg: 2.9 nm 0 Dmax: 11.6 nm

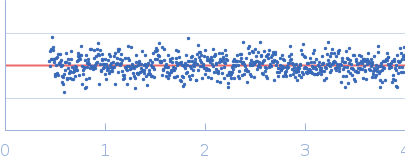
Data validation


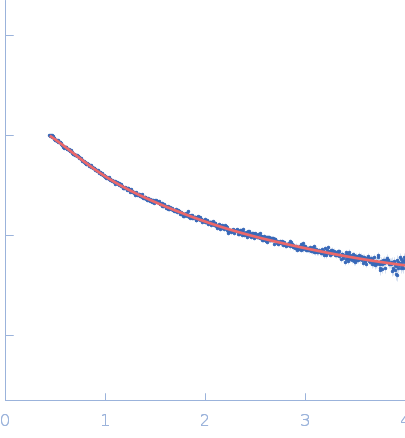
Fits and models


log I(s)
 s, nm-1
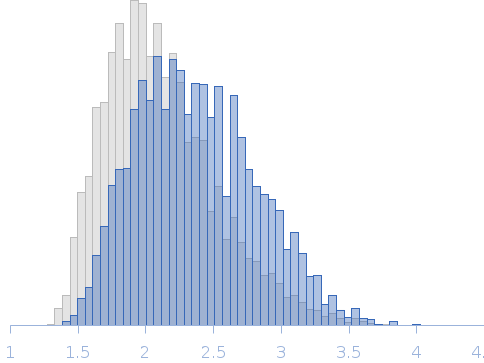
AtCP12-2 in a reduced form Rg histogram Rg, nm
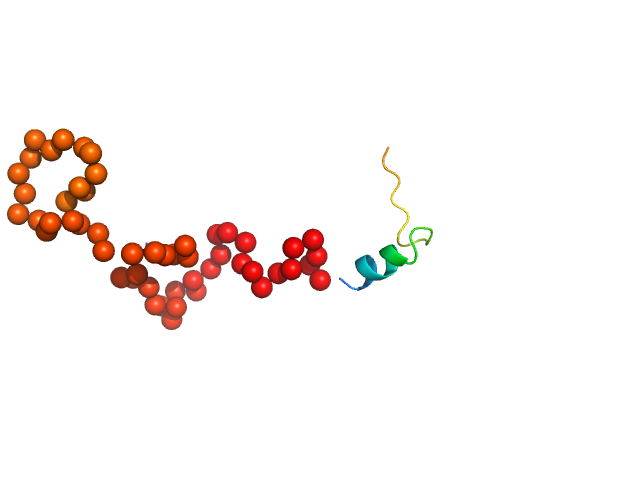
CP12-2 (D77G) EOM/RANCH model

Synchrotron SAXS data from solutions of AtCP12-2 in a reduced form in 25 mM potassium phosphate, pH 7.5 were collected on the BM29 beam line at the ESRF (Grenoble, France) using a Pilatus 1M detector at a sample-detector distance of 2.9 m and at a wavelength of λ = 0.09919 nm (I(s) vs s, where s = 4πsinθ/λ, and 2θ is the scattering angle). Solute concentrations ranging between 0.3 and 5.6 mg/ml were measured at 4°C. 10 successive 1 second frames were collected. The data were normalized to the intensity of the transmitted beam and radially averaged; the scattering of the solvent-blank was subtracted. The low angle data collected at lower concentration were merged with the highest concentration high angle data to yield the final composite scattering curve.

Tags: idp
CP12-2 (D77G) (AtCP12)
Mol. type   Protein
Organism   Arabidopsis thaliana
Olig. state   Monomer
Mon. MW   8.3 kDa
 
UniProt   A0A178VHQ2 (54-131)
Sequence   FASTA