The structural properties of full-length annexin A11

Dudas E, Tully M, Foldes T, Kelly G, Tartaglia G, Pastore A, Frontiers in Molecular Biosciences 11 (2024) DOI

SASDTV5 – Human full-length Annexin A11 (apo form)

Annexin A11
MWexperimental 63 kDa
MWexpected 54 kDa
VPorod 84 nm3
log I(s) 1.97×10² 1.97×101 1.97×100 1.97×10⁻¹
Annexin A11 small angle scattering data  s, nm-1
ln I(s)
Annexin A11 Guinier plot ln 1.98×10² Rg: 3.8 nm 0 (3.8 nm)-2 s2
(sRg)2I(s)/I(0)
Annexin A11 Kratky plot 1.104 0 3 sRg
p(r)
Annexin A11 pair distance distribution function Rg: 3.9 nm 0 Dmax: 15.9 nm

Data validation


There are no models related to this curve.

Synchrotron SAXS data from solutions of full-length Annexin A11 (apo form) in 20 mM Tris, 150 mM KCl, 5 mM EDTA, 1 mM DTT, pH 8.5 were collected on the BM29 beam line at the ESRF (Grenoble, France) using a Pilatus3 2M detector at a sample-detector distance of 2.8 m and at a wavelength of λ = 0.099 nm (I(s) vs s, where s = 4πsinθ/λ, and 2θ is the scattering angle). Solute concentrations ranging between 1.9 and 3.8 mg/ml were measured at 20°C. 10 successive 2 second frames were collected. The data were normalized to the intensity of the transmitted beam and radially averaged; the scattering of the solvent-blank was subtracted. The low angle data collected at lower concentrations were extrapolated to infinite dilution and merged with the higher concentration data to yield the final composite scattering curve.
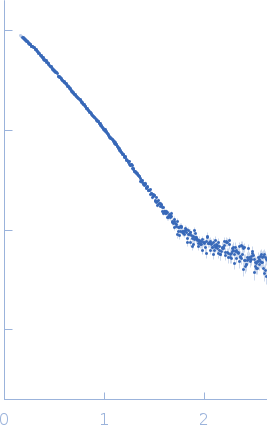
AlphaFold Protein Structure Database entry (monomer): https://alphafold.ebi.ac.uk/entry/P50995

Annexin A11
Mol. type   Protein
Organism   Homo sapiens
Olig. state   Monomer
Mon. MW   54.4 kDa
 
UniProt   P50995 (2-505)
Sequence   FASTA