A conformational fingerprint for amyloidogenic light chains

Paissoni C, Puri S, Broggini L, Sriramoju M, Maritan M, Russo R, Speranzini V, Ballabio F Nuvolone M, Merlini G, Palladini G, Hsu S, Ricagno S, Camilloni C, eLife 13 (2025) DOI

SASDVM4 – Immunoglobulin light chain H7

Immunoglobulin light chain H7
MWexperimental 45 kDa
MWexpected 45 kDa
VPorod 54 nm3
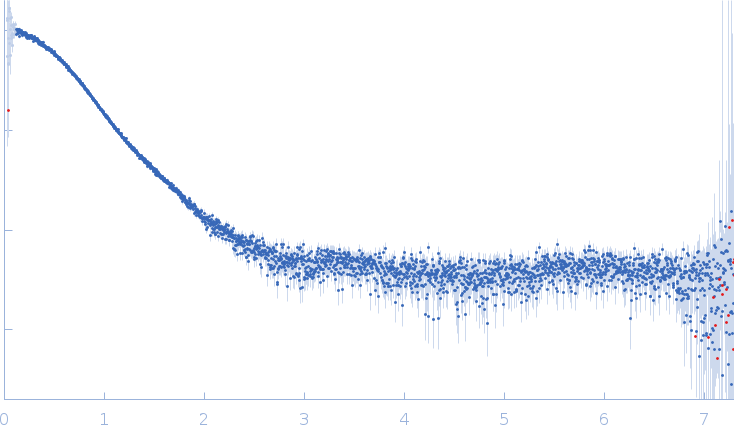
log I(s) 8.11×10² 8.11×101 8.11×100 8.11×10⁻¹
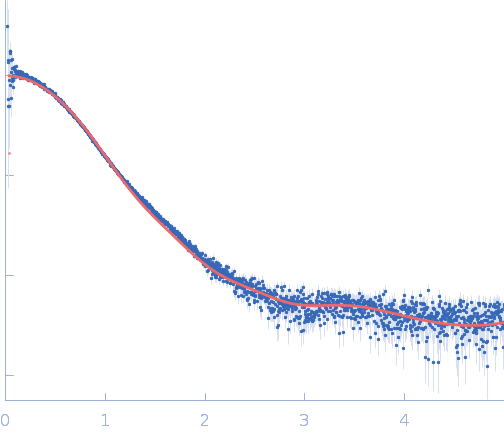
Immunoglobulin light chain H7 small angle scattering data  s, nm-1
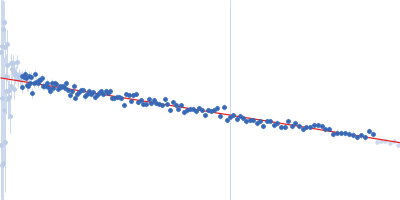
ln I(s)
Immunoglobulin light chain H7 Guinier plot ln 8.11×10² Rg: 2.5 nm 0 (2.5 nm)-2 s2
(sRg)2I(s)/I(0)
Immunoglobulin light chain H7 Kratky plot 1.104 0 3 sRg
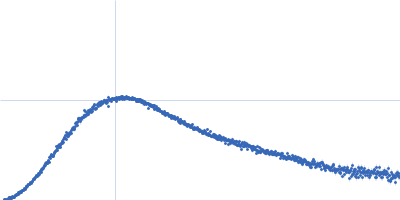
p(r)
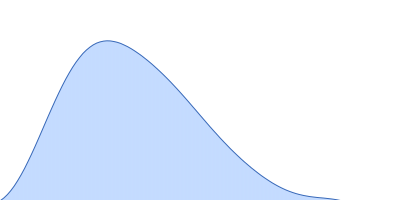
Immunoglobulin light chain H7 pair distance distribution function Rg: 2.5 nm 0 Dmax: 8.4 nm

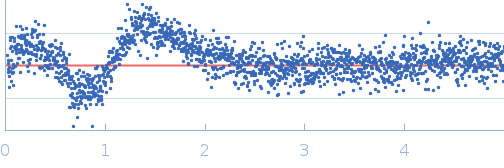
Data validation


Fits and models


log I(s)
 s, nm-1
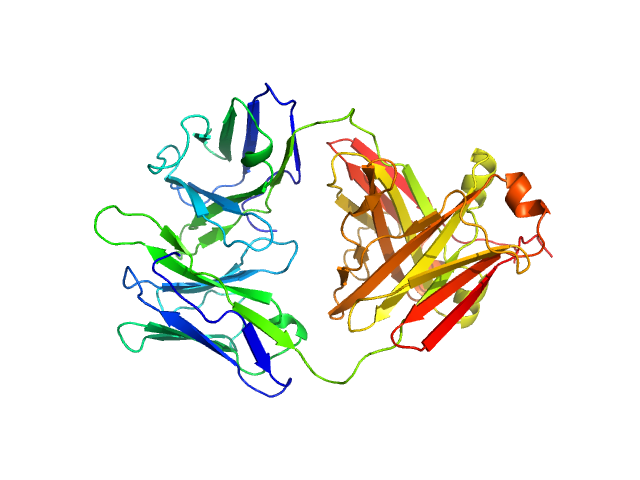
Immunoglobulin light chain H7 MODELLER model

Synchrotron SAXS data from solutions of immunoglobulin light chain H7 in 20 mM TrisHCL, 150 mM NaCl, pH 8 were collected on the EMBL P12 beam line at PETRA III (DESY; Hamburg, Germany) using a Pilatus 6M detector at a sample-detector distance of 2.8 m and at a wavelength of λ = 0.124423 nm (I(s) vs s, where s = 4πsinθ/λ, and 2θ is the scattering angle). One solute concentration of 3.40 mg/ml was measured at 20°C. 20 successive 0.050 second frames were collected. The data were normalized to the intensity of the transmitted beam and radially averaged; the scattering of the solvent-blank was subtracted.

Immunoglobulin light chain H7 (H7)
Mol. type   Protein
Organism   Homo sapiens
Olig. state   Dimer
Mon. MW   22.3 kDa
Sequence   FASTA
 
PDB ID   5MUH