Structural basis for regulation of CELSR1 by a compact module in its extracellular region

Sumit Bandekar.

SASDVS7 – Cadherin EGF LAG seven-pass G-type receptor 1 (CELSR1) ECR without calcium

Cadherin EGF LAG seven-pass G-type receptor 1
MWexperimental 264 kDa
MWexpected 245 kDa
VPorod 473 nm3
log I(s) 1.33×100 1.33×10⁻¹ 1.33×10⁻² 1.33×10⁻³
Cadherin EGF LAG seven-pass G-type receptor 1 small angle scattering data  s, nm-1
ln I(s)
Cadherin EGF LAG seven-pass G-type receptor 1 Guinier plot ln 1.34×100 Rg: 6.0 nm 0 (6.0 nm)-2 s2
(sRg)2I(s)/I(0)
Cadherin EGF LAG seven-pass G-type receptor 1 Kratky plot 1.104 0 3 sRg
p(r)
Cadherin EGF LAG seven-pass G-type receptor 1 pair distance distribution function Rg: 6.2 nm 0 Dmax: 22.5 nm

Data validation


There are no models related to this curve.

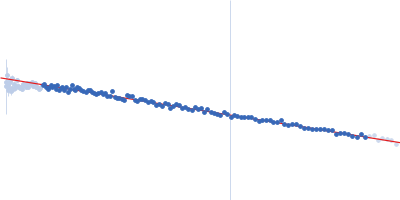
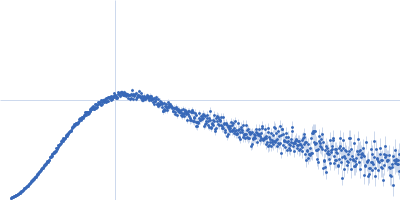
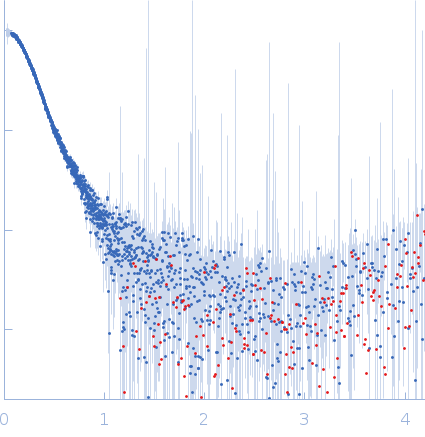
Synchrotron SAXS data from solutions of CELSR1 ECR without calcium in 10 mM Tris, 150 mM NaCl, pH 8.5 were collected on the BioCAT 18ID beam line at the Advanced Photon Source (APS), Argonne National Laboratory (Lemont, IL, USA) using a Eiger2 XE 9M detector at a sample-detector distance of 3.7 m and at a wavelength of λ = 0.1033 nm (I(s) vs s, where s = 4πsinθ/λ, and 2θ is the scattering angle). In-line size-exclusion chromatography (SEC) SAS was employed. The SEC parameters were as follows: A 250.00 μl sample at 0.9 mg/ml was injected at a 0.60 ml/min flow rate onto a GE Superose 6 Increase 10/300 column at 22°C. 2500 successive 0.600 second frames were collected. The data were normalized to the intensity of the transmitted beam and radially averaged; the scattering of the solvent-blank was subtracted.

Cadherin EGF LAG seven-pass G-type receptor 1 (CELSR1)
Mol. type   Protein
Organism   Mus musculus
Olig. state   Monomer
Mon. MW   245.4 kDa
 
UniProt   O35161 (255-2477)
Sequence   FASTA