| MWexperimental | 31 | kDa |
| MWexpected | 39 | kDa |
| VPorod | 52 | nm3 |
|
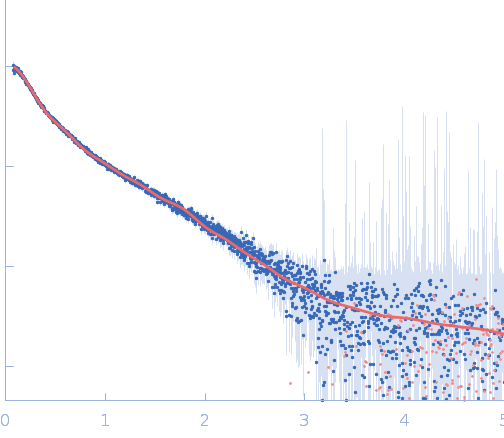
log I(s)
9.03×10⁻²
9.03×10⁻³
9.03×10⁻⁴
9.03×10⁻⁵
|
 s, nm-1
|
|
|
|

|
|
Synchrotron SAXS
data from solutions of
Thomasclavelia ramosa immunoglobulin A protease C-terminal tail
in
25 mM HEPES, 1 mM TCEP, pH 7.5
were collected
on the
ID7A1 BioSAXS / HP-Bio Beamline beam line
at the Cornell High Energy Synchrotron Source (CHESS) storage ring
(Ithaca, NY, USA)
using a Eiger 4M detector
at a wavelength of λ = 0.11013 nm
(I(s) vs s, where s = 4πsinθ/λ, and 2θ is the scattering angle).
One solute concentration of 3.05 mg/ml was measured
at 25°C.
15 successive
1 second frames were collected.
The data were normalized to the intensity of the transmitted beam and radially averaged; the scattering of the solvent-blank was subtracted.
Sample detector distance = UNKNOWN |
|
|||||||||||||||||||||||||||||||||