| MWI(0) | 52 | kDa |
| MWexpected | 7 | kDa |
| VPorod | 10 | nm3 |
|
log I(s)
3.74×10⁻²
3.74×10⁻³
3.74×10⁻⁴
3.74×10⁻⁵
|
 s, nm-1
|
|
|
|

|
|

|
|

|
|
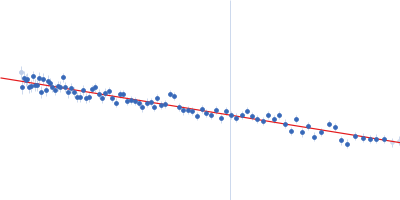
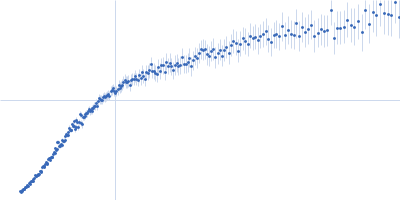
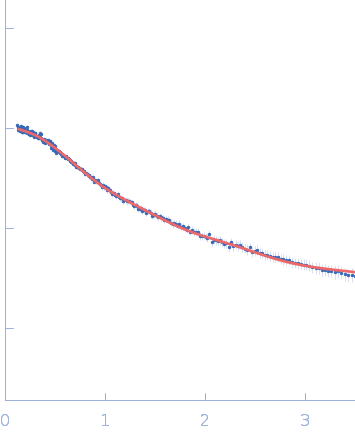
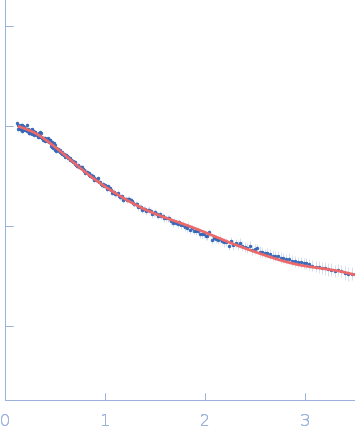
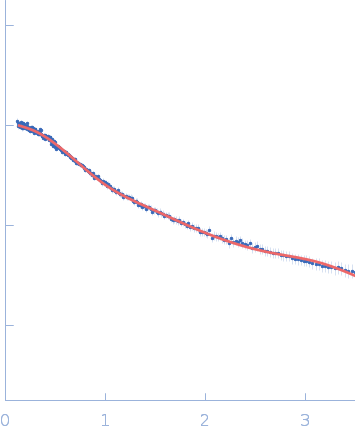
Synchrotron SAXS data from solutions of SERF1a in 20 mM sodium phosphate, 20 mM NaCl, pH 6 were collected on the 13A beam line at the Taiwan Photon Source, NSRRC (Hsinchu, Taiwan) using a Eiger X 9M detector at a sample-detector distance of 2.5 m and at a wavelength of λ = 0.08266 nm (I(s) vs s, where s = 4πsinθ/λ, and 2θ is the scattering angle). Solute concentrations ranging between 15 and 15 mg/ml were measured at 10°C. Five successive 2 second frames were collected. The data were normalized to the intensity of the transmitted beam and radially averaged; the scattering of the solvent-blank was subtracted. The low angle data collected at lower concentration were merged with the highest concentration high angle data to yield the final composite scattering curve.
|
|
|||||||||||||||||||||||||||