|
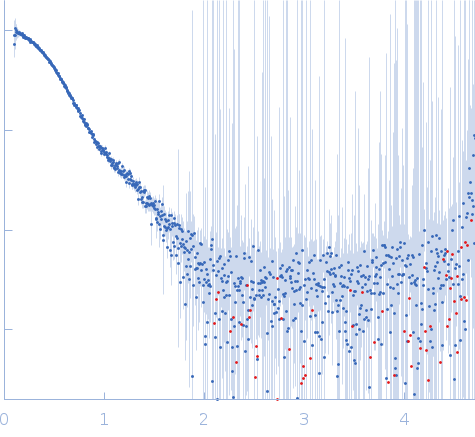
Synchrotron SAXS
data from solutions of
carbohydrate binding duplex of AMY3 (alpha-amylase 3)
in
100 mM potassium phosphate, pH 7.4
were collected
on the
12.3.1 (SIBYLS) beam line
at the Advanced Light Source (ALS) storage ring
(Berkeley, CA, USA)
using a Pilatus3 X 2M detector
at a sample-detector distance of 2 m and
at a wavelength of λ = 0.1127 nm
(I(s) vs s, where s = 4πsinθ/λ, and 2θ is the scattering angle).
One solute concentration of 5.00 mg/ml was measured
at 10°C.
40 successive
0.300 second frames were collected.
The data were normalized to the intensity of the transmitted beam and radially averaged; the scattering of the solvent-blank was subtracted.
Purified CBM was dialyzed into 100 mM potassium phosphate at pH 7.4 and shipped overnight on dry ice and analyzed using HT-SAXS at the SIBYLS beamline at the Advanced Light Source, Lawrence Berkeley National Laboratory, Berkeley, CA.
The incident light wavelength was 1.127 Å at a sample-to-detector distance of 2.1 m. This setup results in scattering vectors, q, ranging from 0.0114 to 0.4 Å−1, where the scattering vector is defined as q = 4πsin(θ)/λ, with θ being the measured scattering angle.
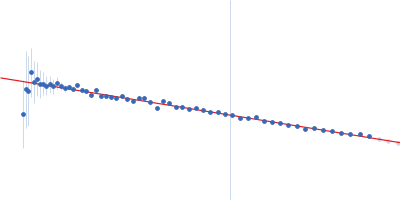
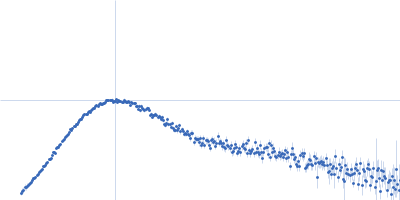
We calculated the Guinier plot to provide information on the aggregation state, the volume of correlation (Vc) to estimate the molecular weight, and the pair distribution function [P(r)] to calculate the maximal inter-particle dimension. Models were fitted to the SAXS data using FOXS.
|
|

 s, nm-1