|
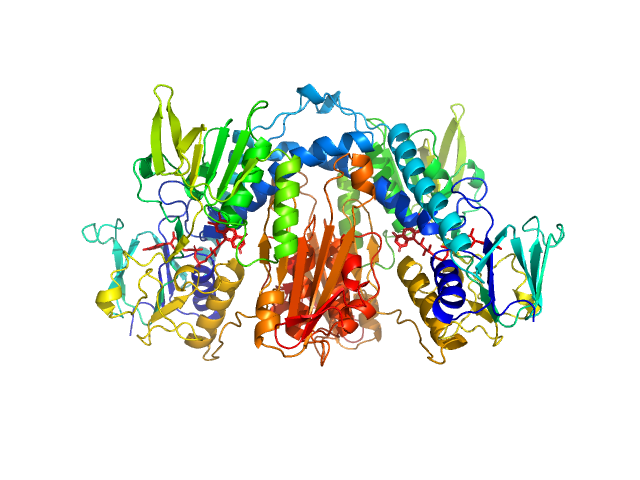
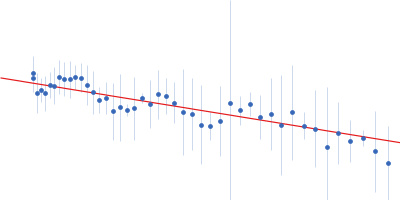
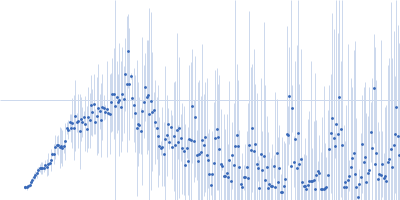
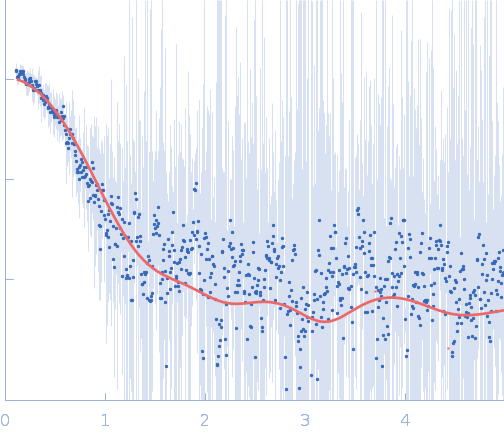
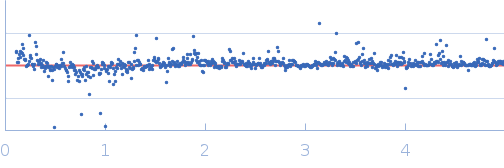
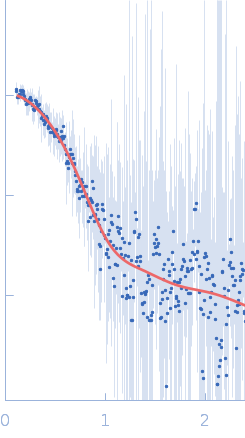
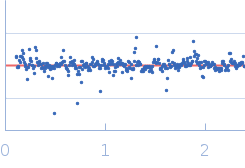
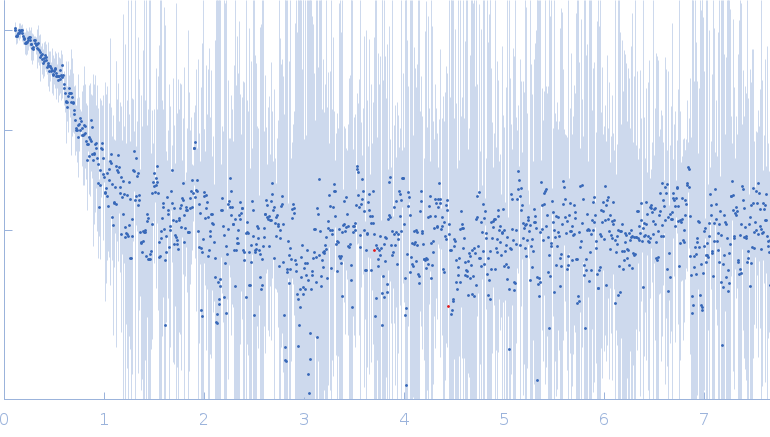
SAXS data from solutions of Leishmania donovani trypanothione reductase in 50 mM Tris, pH 8 were collected using an Anton Pair SAXSpace instrument at the CSIR-Central Drug Research Institute (Lucknow, India) equipped with a Mythen2 R 1K detector at a sample-detector distance of 0.3 m and at a wavelength of λ = 0.154 nm (I(s) vs s, where s = 4πsinθ/λ, and 2θ is the scattering angle). One solute concentration of 4.00 mg/ml was measured at 10°C. Two successive 1800 second frames were collected. The data were normalized to the intensity of the transmitted beam and radially averaged; the scattering of the solvent-blank was subtracted.
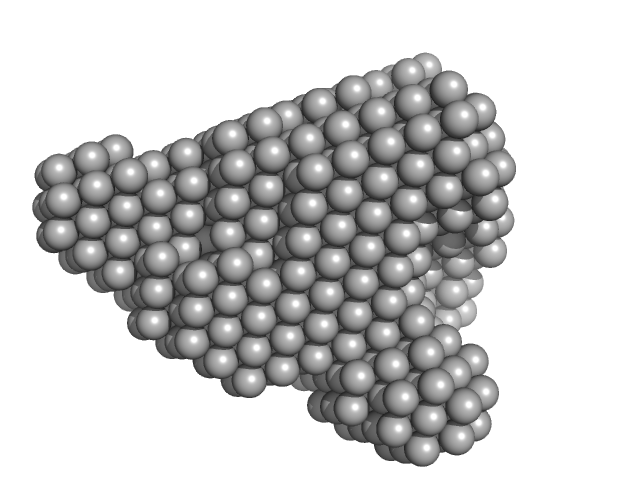
Note: The dummy atom model (DAM) displayed in this entry is derived from the spatial alignment of an individual model cohort consisting of several different models where the aligned models have undergone subsequent volume and bead-occupancy correction (DAMFILT). Consequently, the DAM model displayed in this entry is in no way related to the displayed fit to the data.
|
|

 s, nm-1