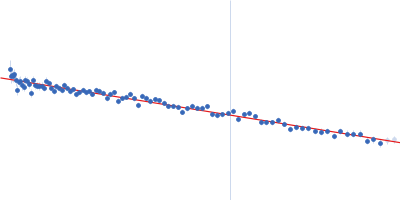
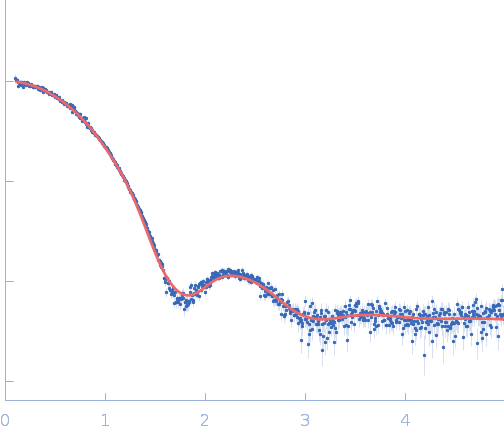
Integrative SAXS and AFM analysis of engineered carbohydrate-active enzyme assemblies with tunable spatial organization.

Pardo Larrabeiti I, Eibinger M, Esque J, Pradeau S, Fort S, Moraïs S, Mizrahi I, Bayer EA, Nidetzky B, Montanier CY, Roblin P, Dumon C, Protein Sci 35(7):e70649 (2026) Europe PMC

SASDYS7 – Glycoside Hydrolase family 8 (AtCel8A) from Acetovibrio thermocellus

ENDOGLUCANASE Cel8A
MWexperimental 36 kDa
MWexpected 42 kDa
VPorod 41 nm3
log I(s) 3.11×10⁻³ 3.11×10⁻⁴ 3.11×10⁻⁵ 3.11×10⁻⁶
ENDOGLUCANASE Cel8A small angle scattering data  s, nm-1
ln I(s)
ENDOGLUCANASE Cel8A Guinier plot ln 3.12×10⁻³ Rg: 2.0 nm 0 (2.0 nm)-2 s2
(sRg)2I(s)/I(0)
ENDOGLUCANASE Cel8A Kratky plot 1.104 0 3 sRg
p(r)
ENDOGLUCANASE Cel8A pair distance distribution function Rg: 2.1 nm 0 Dmax: 6.4 nm

Data validation


Fits and models


log I(s)
 s, nm-1
ENDOGLUCANASE Cel8A GASBOR model

SAXS 
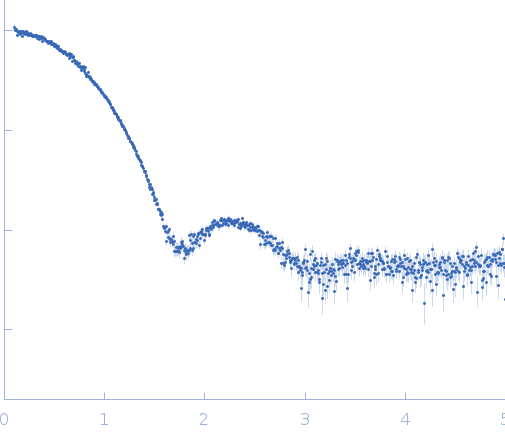
data from solutions of Glycoside Hydrolase family 8 (AtCel8A) from Acetovibrio thermocellus in 25 mM Tris, 150 mM NaCl, pH 8 were collected on the XEUSS 2.0 instrument (Laboratoire de Génie Chimique, Toulouse, France) using a Pilatus 1M detector (DECTRIS, Switzerland) detector at a sample-detector distance of 1.3 m and at a wavelength of λ = 0.154 nm (I(s) vs s, where s = 4πsinθ/λ, and 2θ is the scattering angle). Solute concentrations ranging between 3 and 15 mg/ml were measured at 20°C. 12 successive 600 second frames were collected. The data were normalized to the intensity of the transmitted beam and radially averaged; the scattering of the solvent-blank was subtracted. The low angle data collected at lower concentration were merged with the highest concentration high angle data to yield the final composite scattering curve.
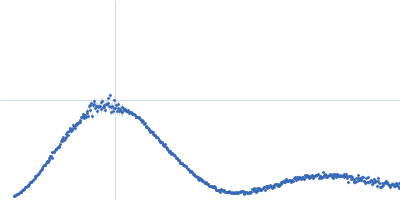
ENDOGLUCANASE Cel8A (Cel8A)
Mol. type   Protein
Organism   Acetovibrio thermocellus
Olig. state   Monomer
Mon. MW   42.0 kDa
 
UniProt   A3DC29 (31-400)
Sequence   FASTA