|
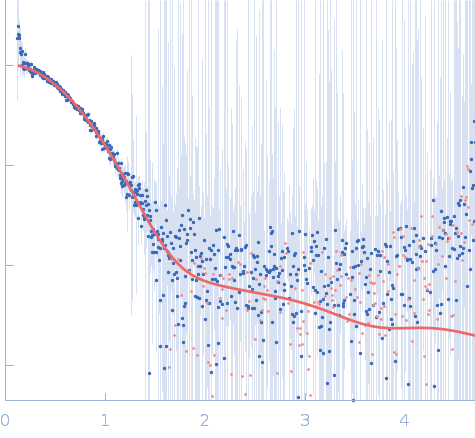
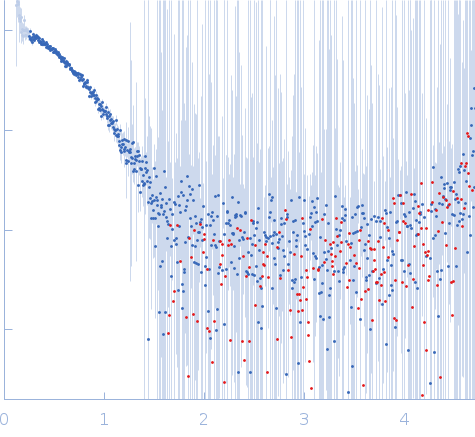
Synchrotron SAXS
data from solutions of
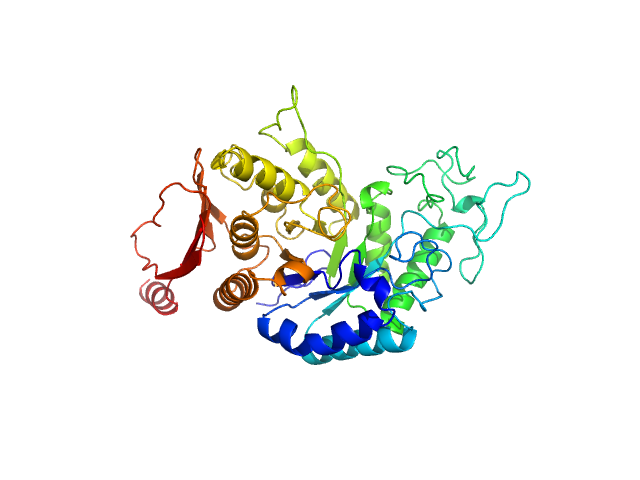
AMY3 (alpha-amylase 3) catalytic domain
in
100 mM potassium phosphate, pH 7.4
were collected
on the
12.3.1 (SIBYLS) beam line
at the Advanced Light Source (ALS) storage ring
(Berkeley, CA, USA)
using a Pilatus3 X 2M detector
at a sample-detector distance of 2 m and
at a wavelength of λ = 0.1127 nm
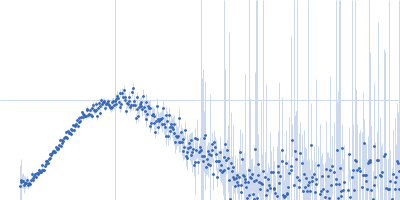
(I(s) vs s, where s = 4πsinθ/λ, and 2θ is the scattering angle).
One solute concentration of 1.00 mg/ml was measured
at 10°C.
50 successive
0.300 second frames were collected.
The data were normalized to the intensity of the transmitted beam and radially averaged; the scattering of the solvent-blank was subtracted.
AMYcat samples were dialyzed into 100 mM potassium phosphate, pH 7.4. For HT-SAXS, AMYcat was diluted in dialysis buffer over a concentration range of 0.3 to 1 mg/mL. SEC-SAXS data were collected with 60 μL of 1 mg/mL AMY3cat.
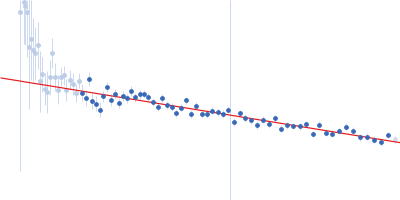
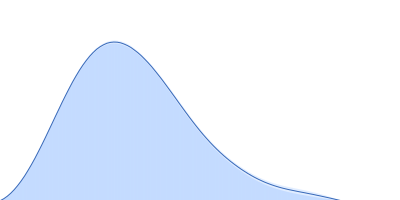
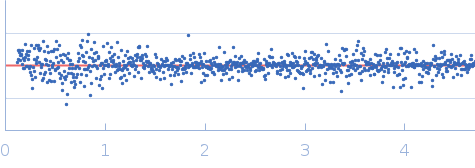
Radially averaged SAXS data files were processed and analyzed in RAW. The radius of gyration (Rg) was calculated for each of the subtracted frames using the Guinier approximation: I(q) = I(0) exp(−q2Rg2/3) with the limits qRg < 1.3. The elution peak was compared to the integral of the ratios to background and Rg relative to the recorded frame using the RAW program. Uniform Rg values across an elution peak represent a homogeneous sample. The final merged SAXS profiles, derived by integrating multiple frames at the elution peak, were used for further analysis. We calculated the Guinier plot to provide information on the aggregation state, the volume of correlation (Vc) to estimate the molecular weight, and the pair distribution function [P(r)] to calculate the maximal inter-particle dimension. Models were fitted to the SAXS data using FOXS.
|
|

 s, nm-1