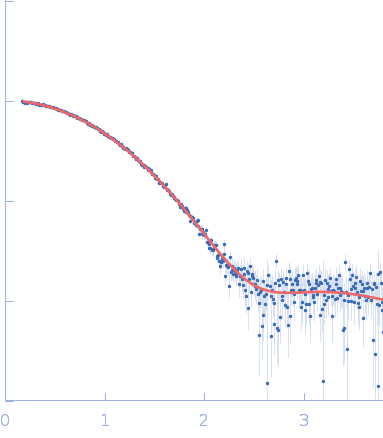
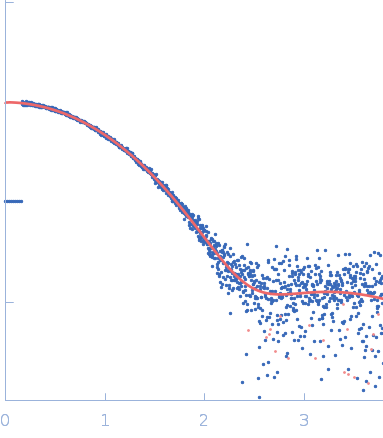
| MWI(0) | 15 | kDa |
| MWexpected | 14 | kDa |
| VPorod | 24 | nm3 |
|
log I(s)
7.79×10²
7.79×101
7.79×100
7.79×10⁻¹
|
 s, nm-1
|
|
|
|

|
|

|
|

|
|
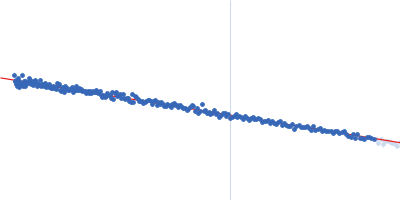
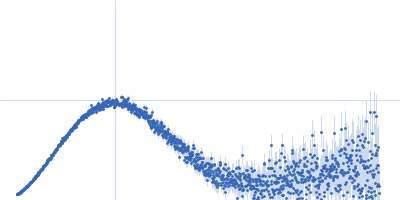
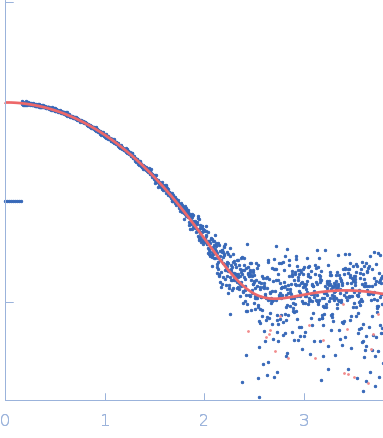
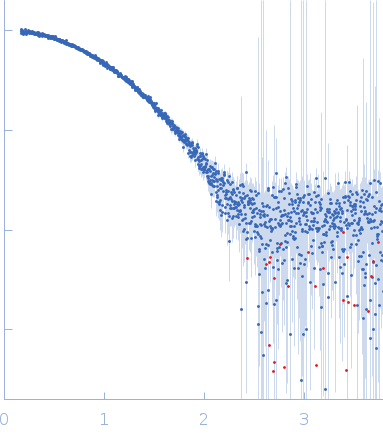
X-ray synchrotron radiation scattering data from a solution of Lysozyme C in 20 mM Sodium Acetate/HEPES, pH 6.8 were collected on the P12 beam line at Petra-III (Hamburg, Germany) using a Pilatus 2M detector (I(s) vs s, where s = 4π sin θ/λ; 2θ is the scattering angle and λ = 0.12 nm). One solute concentration at 2.61 mg/ml was measured using a total exposure time of 1 second (20 x 0.050 second frames). The data were normalized to the intensity of the transmitted beam and radially averaged. Scattering contributions from the matched solvent blank were subtracted and the resulting 1D scattering data were scaled to protein concentration. The data presented in this entry were obtained from a single concentration scattering curve.
Tags:
benchmark
|
|
|||||||||||||||||||||||||||||||||||||||