|
Synchrotron SAXS
data from solutions of
Structure of a complex between full length and truncated CTP1L endolysin
in
20 mM HEPES, pH 7.4
were collected
on the
EMBL X33 beam line
at the DORIS III, DESY storage ring
(Hamburg, Germany)
using a Pilatus 1M-W detector
at a sample-detector distance of 2.7 m and
at a wavelength of λ = 0.15 nm
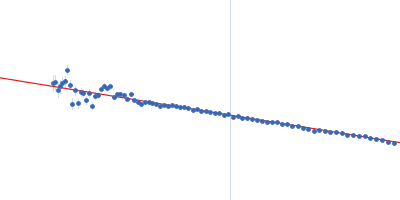
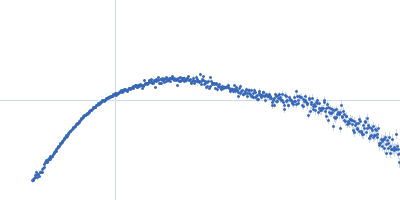
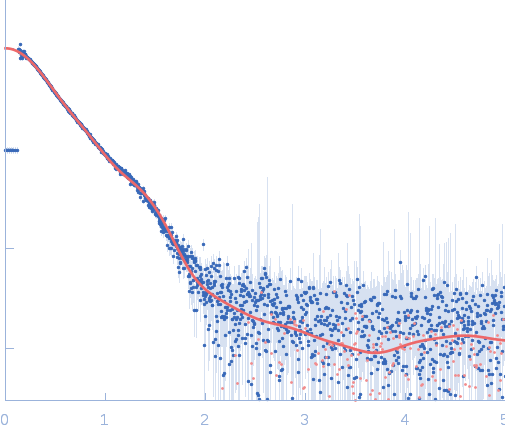
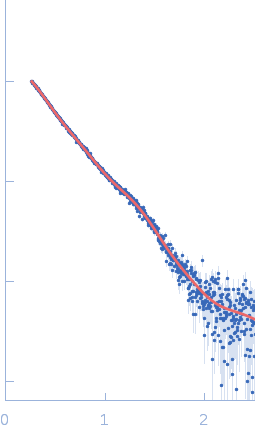
(I(s) vs s, where s = 4πsinθ/λ, and 2θ is the scattering angle).
Solute concentrations ranging between 1 and 4 mg/ml were measured
at 20°C.
Eight successive
15 second frames were collected.
The data were normalized to the intensity of the transmitted beam and radially averaged; the scattering of the solvent-blank was subtracted.
The low angle data collected at lower concentration were merged with the highest concentration high angle data to yield the final composite scattering curve.
Storage temperature = UNKNOWN
|
|
Endolysin
(CTP1L)
|
| Mol. type |
|
Protein |
| Organism |
|
Clostridium phage phiCTP1 |
| Olig. state |
|
Other |
| Mon. MW |
|
32.8 kDa |
| |
| UniProt |
|
D9ZNF3
|
| Sequence |
|
FASTA |
| |
|
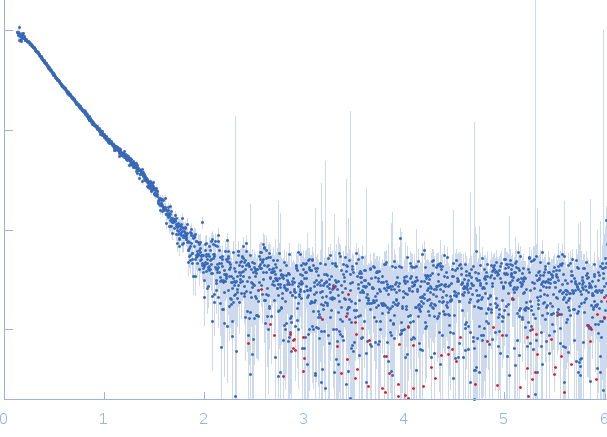 s, nm-1