|
Synchrotron SAXS
data from solutions of
CYNEX4-T266D
in
50 mM HEPES 50 mM KCl, pH 7.5
were collected
on the
EMBL X33 beam line
at the DORIS III, DESY storage ring
(Hamburg, Germany)
using a Pilatus 1M-W detector
at a sample-detector distance of 2.7 m and
at a wavelength of λ = 0.15 nm
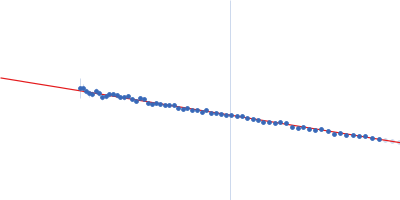
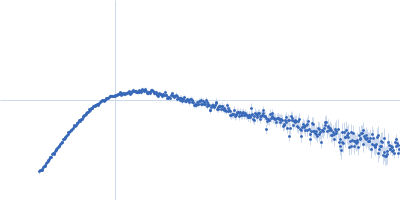
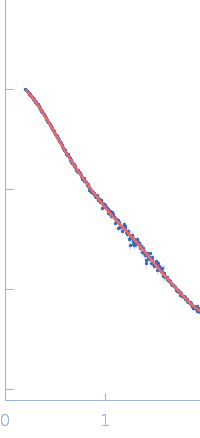
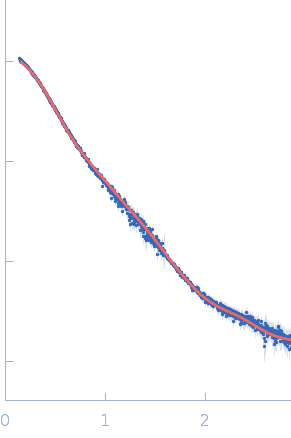
(I(s) vs s, where s = 4πsinθ/λ, and 2θ is the scattering angle).
Solute concentrations ranging between 0.9 and 17 mg/ml were measured
at 10°C.
Eight successive
15 second frames were collected.
The data were normalized to the intensity of the transmitted beam and radially averaged; the scattering of the solvent-blank was subtracted.
The low angle data collected at lower concentration were merged with the highest concentration high angle data to yield the final composite scattering curve.
PED: https://proteinensemble.org/entries/PED00010
|
|
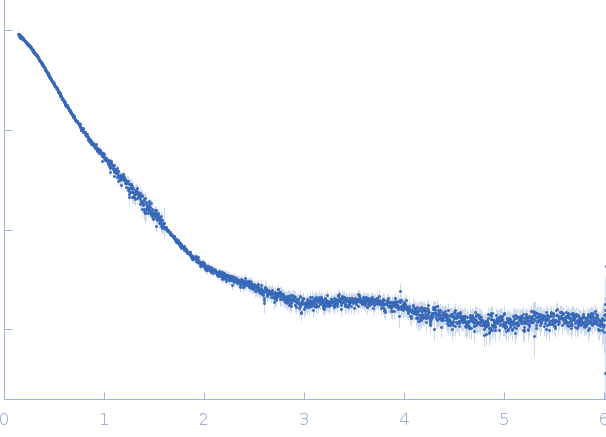 s, nm-1