| MWI(0) | 33 | kDa |
| MWexpected | 36 | kDa |
| VPorod | 54 | nm3 |
|
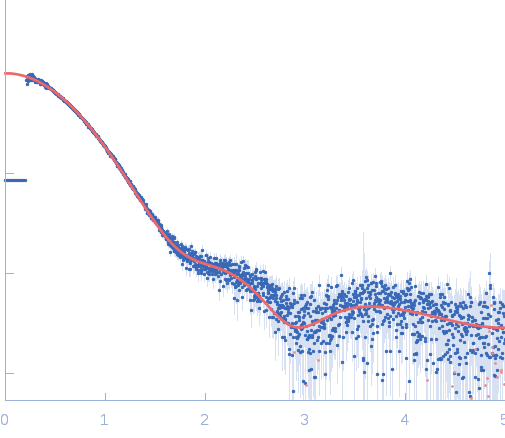
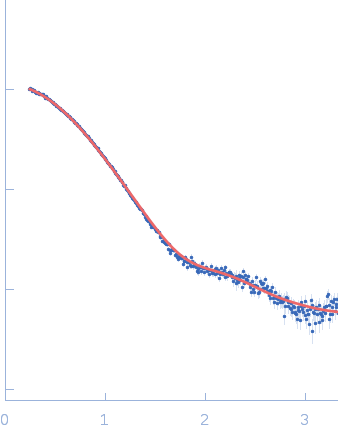
log I(s)
4.02×101
4.02×100
4.02×10⁻¹
4.02×10⁻²
|
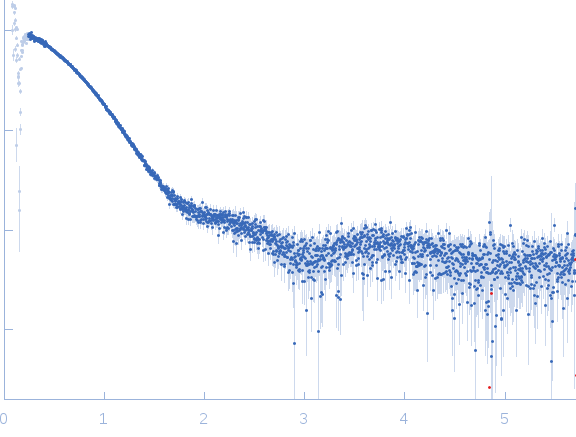 s, nm-1
|
|
|
|

|
|

|
|
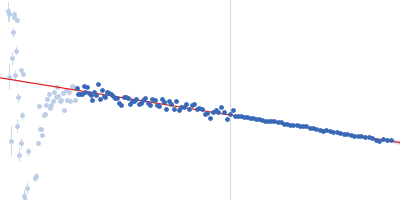
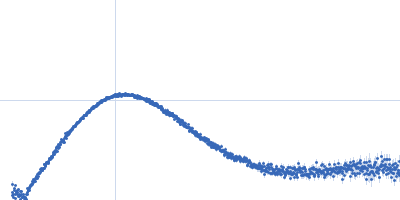
Synchrotron SAXS
data from solutions of
Annexin-A4
in
50 mM HEPES 50 mM KCl, pH 7.5
were collected
on the
EMBL X33 beam line
at the DORIS III, DESY storage ring
(Hamburg, Germany)
using a Pilatus 1M-W detector
at a sample-detector distance of 2.7 m and
at a wavelength of λ = 0.15 nm
(I(s) vs s, where s = 4πsinθ/λ, and 2θ is the scattering angle).
Solute concentrations ranging between 0.4 and 7.3 mg/ml were measured
at 10°C.
Four successive
30 second frames were collected.
The data were normalized to the intensity of the transmitted beam and radially averaged; the scattering of the solvent-blank was subtracted.
The low angle data collected at lower concentrations were extrapolated to infinite dilution and merged with the higher concentration data to yield the final composite scattering curve.
Tags:
X33
|
|
|||||||||||||||||||||